Monday, February 28, 2011

Single family residential breakdown of sales by housing types


Toronto Real Estate Board (TREB) Average Prices and GraphFor more information please contact A. Mark ArgentinoA. Mark Argentino, Broker, P.Eng.,Specializing in Residential & Investment Real EstateRE/MAX Realty Specialists Inc., Brokerage2691 Credit Valley Road, Suite 101, Mississauga, Ontario L5M 7A1BUS. 905-828-3434FAX. 905-828-2829E-MAIL: mark@mississauga4sale.comWebsite: Mississauga4Sale.com

Sunday, February 27, 2011

TREB Number of Sale Average Prices month by month since January 2010 to January 2011


Toronto Real Estate Board (TREB) Average Prices and GraphFor more information please contact A. Mark ArgentinoA. Mark Argentino, Broker, P.Eng.,Specializing in Residential & Investment Real EstateRE/MAX Realty Specialists Inc., Brokerage2691 Credit Valley Road, Suite 101, Mississauga, Ontario L5M 7A1BUS. 905-828-3434FAX. 905-828-2829E-MAIL: mark@mississauga4sale.comWebsite: Mississauga4Sale.com

Saturday, February 26, 2011

TREB Sales Activing Listings and Average price graphs for past 12 months


Toronto Real Estate Board (TREB) Average Prices and GraphFor more information please contact A. Mark ArgentinoA. Mark Argentino, Broker, P.Eng.,Specializing in Residential & Investment Real EstateRE/MAX Realty Specialists Inc., Brokerage2691 Credit Valley Road, Suite 101, Mississauga, Ontario L5M 7A1BUS. 905-828-3434FAX. 905-828-2829E-MAIL: mark@mississauga4sale.comWebsite: Mississauga4Sale.com

Friday, February 25, 2011

TREB Affordability Indicator Share of Average Household Income Used for Mortgage

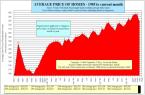
Explanation: This chart plots the share of average household income that goes toward mortgage principal and interest, property taxes and utilities for the average priced home in the GTA subject to the following assumptions:
1.Average annual or year-to-date home price as reported by TREB
2.20 per cent down payment
3.Average 5-year fixed mortgage rate (Statistics Canada); 25-year amortization
4.Average property tax rate reported by/estimated from the Statistics Canada Survey of Household Spending
5.Average utilities cost reported by/estimated from the Statistics Canada Survey of Household Spending and components of the Consumer Price Index
6.Average household income reported by the Census of Canada. Years in between Censuses estimated using interpolation (years upto2005) or annual growth in average weekly earnings reported by Statistics Canada in the LabourForce Survey (2006 onward).
Source: Toronto Real Estate Board Data and Calculation; Statistics Canada TREB Affordability Indicator Share of Average Household Income Used for Mortgage Principal and Interest, Property Taxes and Utilities on the Averaged Priced GTA Resale Home


Toronto Real Estate Board (TREB) Average Prices and GraphFor more information please contact A. Mark ArgentinoA. Mark Argentino, Broker, P.Eng.,Specializing in Residential & Investment Real EstateRE/MAX Realty Specialists Inc., Brokerage2691 Credit Valley Road, Suite 101, Mississauga, Ontario L5M 7A1BUS. 905-828-3434FAX. 905-828-2829E-MAIL: mark@mississauga4sale.comWebsite: Mississauga4Sale.com

Thursday, February 24, 2011

TREB Sales-to-New Listings Ratio Compared to Average Annual Per Cent Change in Home PriceSales-to-New Listings Ratio Average Price Annual % change

Explanation: This chart plots the monthly sales-to-new listings ratio (blue line) with year-over-year average annual per cent price change (brown line). When the sales-to-new listings ratio moves higher, average annual per cent change in home prices generally trends higher. When the sales-to-new listings ratio moves lower, average annual per cent change in home prices generally trends lower.
Average Price Annual Per Cent Change(Brown Line)Sales-to-New Listings Ratio(Blue Line)Source: Toronto Real Estate BoardTREB MLS®


Toronto Real Estate Board (TREB) Average Prices and GraphFor more information please contact A. Mark ArgentinoA. Mark Argentino, Broker, P.Eng.,Specializing in Residential & Investment Real EstateRE/MAX Realty Specialists Inc., Brokerage2691 Credit Valley Road, Suite 101, Mississauga, Ontario L5M 7A1BUS. 905-828-3434FAX. 905-828-2829E-MAIL: mark@mississauga4sale.comWebsite: Mississauga4Sale.com

Wednesday, February 23, 2011

Average Price Monthly Time Series with Trend Line Actual MLS® Average PriceTrend (12-Month Moving Average) Toronto Real Estate Board TREB MLS®

This chart plots monthly MLS® average price since January 1995. The blue line shows the actual average price. The brown line is the trend computed using a 12-month moving average, which exhibits no seasonal variations or other irregular fluctuations. A substantial change in actual average price must occur to change the direction of the trend.


Toronto Real Estate Board (TREB) Average Prices and GraphFor more information please contact A. Mark ArgentinoA. Mark Argentino, Broker, P.Eng.,Specializing in Residential & Investment Real EstateRE/MAX Realty Specialists Inc., Brokerage2691 Credit Valley Road, Suite 101, Mississauga, Ontario L5M 7A1BUS. 905-828-3434FAX. 905-828-2829E-MAIL: mark@mississauga4sale.comWebsite: Mississauga4Sale.com

Tuesday, February 22, 2011

New Listings Monthly Time Series with Trend Line Actual MLS® New ListingsTrend (12-Month Moving Average) TREB MLS®

Explanation: This chart plots monthly MLS® new listings since January 1995. The blue line shows actual new listings. The brown line is the trend computed using a 12-month moving average, which exhibits no seasonal variations or other irregular fluctuations. A substantial change in actual new listings must occur to change the direction of the trend.
Source: Toronto Real Estate Board


Toronto Real Estate Board (TREB) Average Prices and GraphFor more information please contact A. Mark ArgentinoA. Mark Argentino, Broker, P.Eng.,Specializing in Residential & Investment Real EstateRE/MAX Realty Specialists Inc., Brokerage2691 Credit Valley Road, Suite 101, Mississauga, Ontario L5M 7A1BUS. 905-828-3434FAX. 905-828-2829E-MAIL: mark@mississauga4sale.comWebsite: Mississauga4Sale.com

Monday, February 21, 2011

Monthly Time Series with Trend Line Actual MLS® SalesTrend (12-Month Moving Average) TREB MLS® Sales

Explanation: This chart plots monthly MLS® sales since January 1995. The blue line shows actual sales. The brown line is the trend computed using a 12-month moving average, which exhibits no seasonal variations or other irregular fluctuations. A substantial change in actual sales must occur to change the direction of the trend.

Source: Toronto Real Estate Board


Toronto Real Estate Board (TREB) Average Prices and GraphFor more information please contact A. Mark ArgentinoA. Mark Argentino, Broker, P.Eng.,Specializing in Residential & Investment Real EstateRE/MAX Realty Specialists Inc., Brokerage2691 Credit Valley Road, Suite 101, Mississauga, Ontario L5M 7A1BUS. 905-828-3434FAX. 905-828-2829E-MAIL: mark@mississauga4sale.comWebsite: Mississauga4Sale.com

Sunday, February 20, 2011

TERB Average Annual and Median Prices back to 2001


Toronto Real Estate Board (TREB) Average Prices and GraphFor more information please contact A. Mark ArgentinoA. Mark Argentino, Broker, P.Eng.,Specializing in Residential & Investment Real EstateRE/MAX Realty Specialists Inc., Brokerage2691 Credit Valley Road, Suite 101, Mississauga, Ontario L5M 7A1BUS. 905-828-3434FAX. 905-828-2829E-MAIL: mark@mississauga4sale.comWebsite: Mississauga4Sale.com

Saturday, February 19, 2011

Housing Market Indicators, Sales, new listings, active listings and days on the market


Toronto Real Estate Board (TREB) Average Prices and GraphFor more information please contact A. Mark ArgentinoA. Mark Argentino, Broker, P.Eng.,Specializing in Residential & Investment Real EstateRE/MAX Realty Specialists Inc., Brokerage2691 Credit Valley Road, Suite 101, Mississauga, Ontario L5M 7A1BUS. 905-828-3434FAX. 905-828-2829E-MAIL: mark@mississauga4sale.comWebsite: Mississauga4Sale.com