The reason that January and February are good months to sell your home or property is because the competition is far lower compared to other times of the year. This means that you may be able to set your asking price at a healthy amount and since there is so little competition, you may find that you receive a good offer under your terms and conditions.
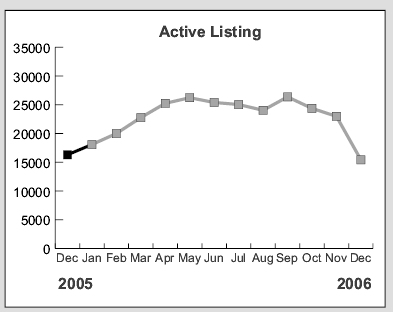
See the graph below showing the number of active listings is at it's lowest amount of the year. Also listings to sales ratios at the chart below and note that the number of listings is down.
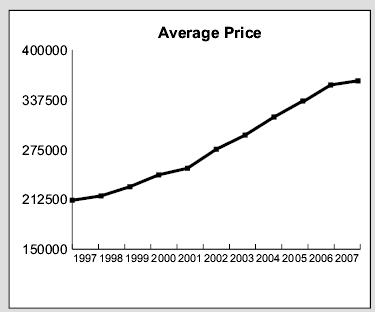
Prices are at historic levels, good time to sell, see the graph below
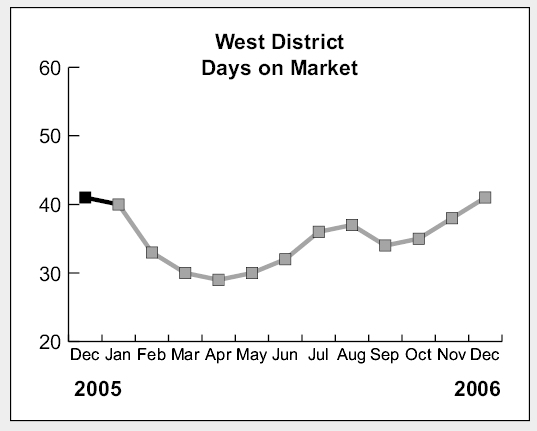
Time on the market is shown on this graph and you will note that in January and February the days on the market plummets, meaning that it's still a good time of year to sell.
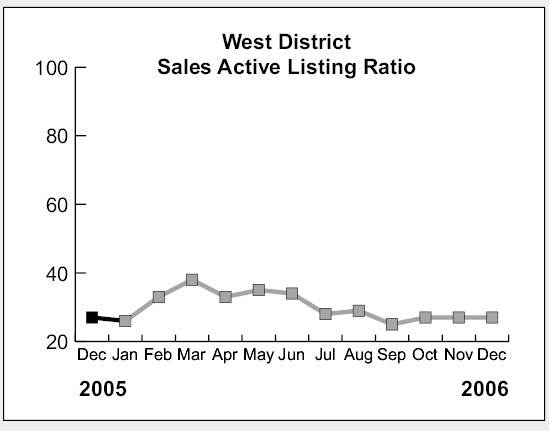
Sales to active listings also increases dramatically in January and February
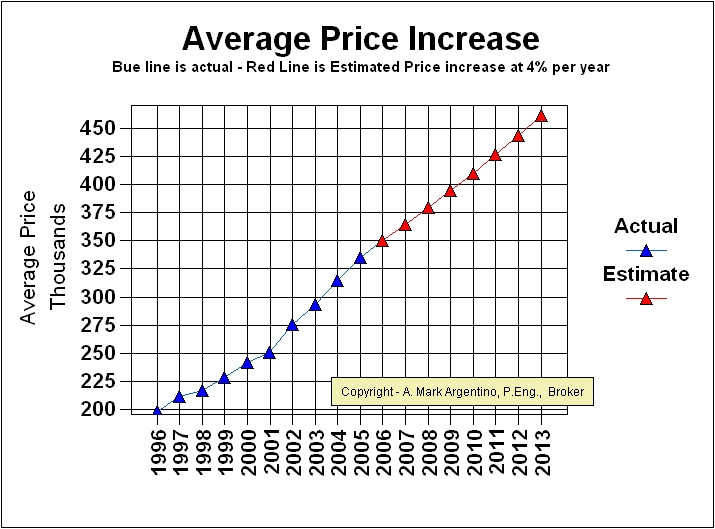
See a graph of the average prices over the past 15 years.
Graph of TREB Prices
The average single family residential price increased the following amounts in the past few years
The table above shows that prices have increased steadily since 1997, nearly 10 years of unprecedented growth. These figures give an overall trend of the average prices of single family residential prices in the Toronto and GTA marketplace.
Of note is the fact that although the central core prices of real estate have escalated at a much higher rate than the values above. TREB (the Toronto Real Estate Board) has continued it's expansion of MLS boundaries and therefore the average prices above take into account cities and towns that are much further out from the core that have much lower average prices compared to the city core. This shows how great of an impact the high prices in the central city have on the overall price. I don't know exactly how many kilometers of outward growth that TREB experienced over the past 10 years, but I would guess that at least tens of thousands of new properties have been taken into account when calculating the year over year figures.
If prices from 2007 for the next 5 years were to increase at an annual rate of 4% then the average price would be over $460,000 in 2013. The graph below shows this estimated price increase.
Below is a Graph showing TREB Historical Average Price Data
- The graph below shows a graph of sales price data obtained directly from the Toronto Real Estate Board showing the average selling price of single family homes from 1985 to date in our GTA marketplace.
- Note the historical trends for spring and fall price increases, where spring typically has a larger increase compared to the fall.
- The benchmark for changes in price is chosen to be the average price of homes at the last height of the market, which was $273,698 in 1989.
- If you want the actual values of prices for every month going back to January 1995, I have them, and would be pleased to E-mail them to you upon request.
- See the Average Price Cycles from January 1995 to Date - a very interesting cyclical pattern is clearly seen!
- You may also see the average mortgage interest rates back to 1979
- Send Mark a request for the actual prices of homes since 1995 or you can call Mark now at 905-828-3434
- Open the graph below in a new separate window
For more information please contact A. Mark Argentino
A. Mark Argentino Associate Broker, P.Eng.,
Specializing in Residential & Investment Real Estate
RE/MAX Realty Specialists Inc.
2691 Credit Valley Road, Suite 101, Mississauga, Ontario L5M 7A1
BUS 905-828-3434
FAX 905-828-2829
E-MAIL mark@mississauga4sale.com
Website: Mississauga4Sale.com


No comments:
Post a Comment