
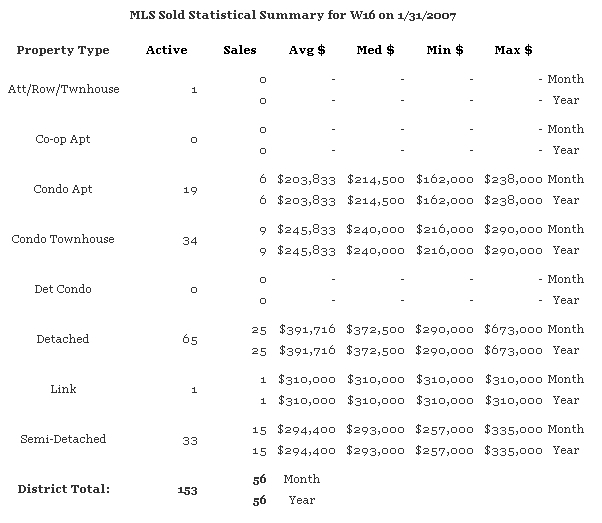
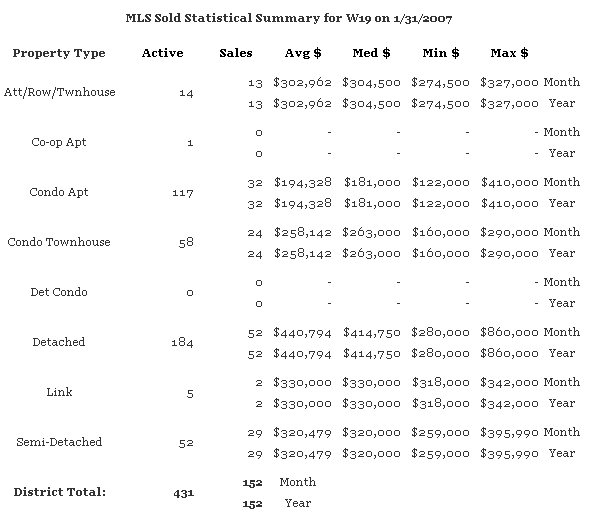
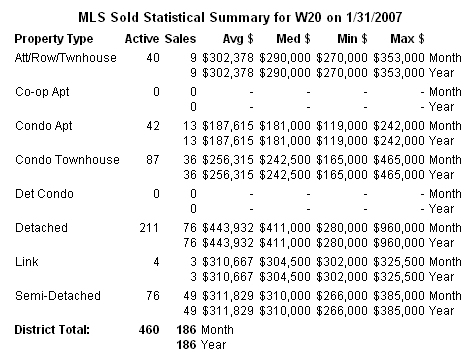
In the three tables below you can see the sales statistics for the month of January 2007. The stats show the averages for Freehold townhomes, townhome condos, high rise condos, semi detached home, detached homes, co-operative homes, link detached homes and detached condos that were sold in the areas of W16, W19 and W20
If you are not sure of the boundaries for these zones, please browse to this page and it will show you all the W zones and you may click the zone to see details and boundaries.
MLS Sold Statistical Summary for W19 on 1/31/2007
MLS Sold Statistical Summary for W20 on 1/31/2007
W16
W19
See all the stats and numbers at this page
For more information please contact A. Mark Argentino
A. Mark Argentino Associate Broker, P.Eng.,
Specializing in Residential & Investment Real Estate
RE/MAX Realty Specialists Inc.
2691 Credit Valley Road, Suite 101, Mississauga, Ontario L5M 7A1
BUS 905-828-3434
FAX 905-828-2829
E-MAIL mark@mississauga4sale.com
Website: Mississauga4Sale.com


No comments:
Post a Comment