Monday, February 28, 2011

Single family residential breakdown of sales by housing types


Toronto Real Estate Board (TREB) Average Prices and GraphFor more information please contact A. Mark ArgentinoA. Mark Argentino, Broker, P.Eng.,Specializing in Residential & Investment Real EstateRE/MAX Realty Specialists Inc., Brokerage2691 Credit Valley Road, Suite 101, Mississauga, Ontario L5M 7A1BUS. 905-828-3434FAX. 905-828-2829E-MAIL: mark@mississauga4sale.comWebsite: Mississauga4Sale.com

Sunday, February 27, 2011

TREB Number of Sale Average Prices month by month since January 2010 to January 2011


Toronto Real Estate Board (TREB) Average Prices and GraphFor more information please contact A. Mark ArgentinoA. Mark Argentino, Broker, P.Eng.,Specializing in Residential & Investment Real EstateRE/MAX Realty Specialists Inc., Brokerage2691 Credit Valley Road, Suite 101, Mississauga, Ontario L5M 7A1BUS. 905-828-3434FAX. 905-828-2829E-MAIL: mark@mississauga4sale.comWebsite: Mississauga4Sale.com

Saturday, February 26, 2011

TREB Sales Activing Listings and Average price graphs for past 12 months


Toronto Real Estate Board (TREB) Average Prices and GraphFor more information please contact A. Mark ArgentinoA. Mark Argentino, Broker, P.Eng.,Specializing in Residential & Investment Real EstateRE/MAX Realty Specialists Inc., Brokerage2691 Credit Valley Road, Suite 101, Mississauga, Ontario L5M 7A1BUS. 905-828-3434FAX. 905-828-2829E-MAIL: mark@mississauga4sale.comWebsite: Mississauga4Sale.com

Friday, February 25, 2011

TREB Affordability Indicator Share of Average Household Income Used for Mortgage

Explanation: This chart plots the share of average household income that goes toward mortgage principal and interest, property taxes and utilities for the average priced home in the GTA subject to the following assumptions:
1.Average annual or year-to-date home price as reported by TREB
2.20 per cent down payment
3.Average 5-year fixed mortgage rate (Statistics Canada); 25-year amortization
4.Average property tax rate reported by/estimated from the Statistics Canada Survey of Household Spending
5.Average utilities cost reported by/estimated from the Statistics Canada Survey of Household Spending and components of the Consumer Price Index
6.Average household income reported by the Census of Canada. Years in between Censuses estimated using interpolation (years upto2005) or annual growth in average weekly earnings reported by Statistics Canada in the LabourForce Survey (2006 onward).
Source: Toronto Real Estate Board Data and Calculation; Statistics Canada TREB Affordability Indicator Share of Average Household Income Used for Mortgage Principal and Interest, Property Taxes and Utilities on the Averaged Priced GTA Resale Home


Toronto Real Estate Board (TREB) Average Prices and GraphFor more information please contact A. Mark ArgentinoA. Mark Argentino, Broker, P.Eng.,Specializing in Residential & Investment Real EstateRE/MAX Realty Specialists Inc., Brokerage2691 Credit Valley Road, Suite 101, Mississauga, Ontario L5M 7A1BUS. 905-828-3434FAX. 905-828-2829E-MAIL: mark@mississauga4sale.comWebsite: Mississauga4Sale.com

Thursday, February 24, 2011

TREB Sales-to-New Listings Ratio Compared to Average Annual Per Cent Change in Home PriceSales-to-New Listings Ratio Average Price Annual % change

Explanation: This chart plots the monthly sales-to-new listings ratio (blue line) with year-over-year average annual per cent price change (brown line). When the sales-to-new listings ratio moves higher, average annual per cent change in home prices generally trends higher. When the sales-to-new listings ratio moves lower, average annual per cent change in home prices generally trends lower.
Average Price Annual Per Cent Change(Brown Line)Sales-to-New Listings Ratio(Blue Line)Source: Toronto Real Estate BoardTREB MLS®


Toronto Real Estate Board (TREB) Average Prices and GraphFor more information please contact A. Mark ArgentinoA. Mark Argentino, Broker, P.Eng.,Specializing in Residential & Investment Real EstateRE/MAX Realty Specialists Inc., Brokerage2691 Credit Valley Road, Suite 101, Mississauga, Ontario L5M 7A1BUS. 905-828-3434FAX. 905-828-2829E-MAIL: mark@mississauga4sale.comWebsite: Mississauga4Sale.com

Wednesday, February 23, 2011

Average Price Monthly Time Series with Trend Line Actual MLS® Average PriceTrend (12-Month Moving Average) Toronto Real Estate Board TREB MLS®

This chart plots monthly MLS® average price since January 1995. The blue line shows the actual average price. The brown line is the trend computed using a 12-month moving average, which exhibits no seasonal variations or other irregular fluctuations. A substantial change in actual average price must occur to change the direction of the trend.


Toronto Real Estate Board (TREB) Average Prices and GraphFor more information please contact A. Mark ArgentinoA. Mark Argentino, Broker, P.Eng.,Specializing in Residential & Investment Real EstateRE/MAX Realty Specialists Inc., Brokerage2691 Credit Valley Road, Suite 101, Mississauga, Ontario L5M 7A1BUS. 905-828-3434FAX. 905-828-2829E-MAIL: mark@mississauga4sale.comWebsite: Mississauga4Sale.com

Tuesday, February 22, 2011

New Listings Monthly Time Series with Trend Line Actual MLS® New ListingsTrend (12-Month Moving Average) TREB MLS®

Explanation: This chart plots monthly MLS® new listings since January 1995. The blue line shows actual new listings. The brown line is the trend computed using a 12-month moving average, which exhibits no seasonal variations or other irregular fluctuations. A substantial change in actual new listings must occur to change the direction of the trend.
Source: Toronto Real Estate Board


Toronto Real Estate Board (TREB) Average Prices and GraphFor more information please contact A. Mark ArgentinoA. Mark Argentino, Broker, P.Eng.,Specializing in Residential & Investment Real EstateRE/MAX Realty Specialists Inc., Brokerage2691 Credit Valley Road, Suite 101, Mississauga, Ontario L5M 7A1BUS. 905-828-3434FAX. 905-828-2829E-MAIL: mark@mississauga4sale.comWebsite: Mississauga4Sale.com

Monday, February 21, 2011

Monthly Time Series with Trend Line Actual MLS® SalesTrend (12-Month Moving Average) TREB MLS® Sales

Explanation: This chart plots monthly MLS® sales since January 1995. The blue line shows actual sales. The brown line is the trend computed using a 12-month moving average, which exhibits no seasonal variations or other irregular fluctuations. A substantial change in actual sales must occur to change the direction of the trend.

Source: Toronto Real Estate Board


Toronto Real Estate Board (TREB) Average Prices and GraphFor more information please contact A. Mark ArgentinoA. Mark Argentino, Broker, P.Eng.,Specializing in Residential & Investment Real EstateRE/MAX Realty Specialists Inc., Brokerage2691 Credit Valley Road, Suite 101, Mississauga, Ontario L5M 7A1BUS. 905-828-3434FAX. 905-828-2829E-MAIL: mark@mississauga4sale.comWebsite: Mississauga4Sale.com

Sunday, February 20, 2011

TERB Average Annual and Median Prices back to 2001


Toronto Real Estate Board (TREB) Average Prices and GraphFor more information please contact A. Mark ArgentinoA. Mark Argentino, Broker, P.Eng.,Specializing in Residential & Investment Real EstateRE/MAX Realty Specialists Inc., Brokerage2691 Credit Valley Road, Suite 101, Mississauga, Ontario L5M 7A1BUS. 905-828-3434FAX. 905-828-2829E-MAIL: mark@mississauga4sale.comWebsite: Mississauga4Sale.com

Saturday, February 19, 2011

Housing Market Indicators, Sales, new listings, active listings and days on the market


Toronto Real Estate Board (TREB) Average Prices and GraphFor more information please contact A. Mark ArgentinoA. Mark Argentino, Broker, P.Eng.,Specializing in Residential & Investment Real EstateRE/MAX Realty Specialists Inc., Brokerage2691 Credit Valley Road, Suite 101, Mississauga, Ontario L5M 7A1BUS. 905-828-3434FAX. 905-828-2829E-MAIL: mark@mississauga4sale.comWebsite: Mississauga4Sale.com

Friday, February 18, 2011

Toronto Real Estate Board TREB MLS® Average Resale Home Price Monthly with Three Previous Years for Comparison

This chart plots the monthly MLS® average home price for the current year and the previous three years. The recurring seasonal trend can be examined along with comparisons to previous years for each month.


Toronto Real Estate Board (TREB) Average Prices and GraphFor more information please contact A. Mark ArgentinoA. Mark Argentino, Broker, P.Eng.,Specializing in Residential & Investment Real EstateRE/MAX Realty Specialists Inc., Brokerage2691 Credit Valley Road, Suite 101, Mississauga, Ontario L5M 7A1BUS. 905-828-3434FAX. 905-828-2829E-MAIL: mark@mississauga4sale.comWebsite: Mississauga4Sale.com

Thursday, February 17, 2011

Prices up Number of sales down in GTA real estate marketplace for mid February 2011

The volume of sales is down in the GTA because inventories are down. There is high demand, this is why prices are increasing, but low inventories of good homes for sale. If you are interested in selling this year, now is the time to do it!

Bottom line: We need more listings on the market!

See the mid month report from TREB below.

All the best,
Mark


GTA REALTORS(r) Report Mid-Month Resale Housing Market Figures

TORONTO, February 17, 2011 -- Greater Toronto REALTORS(r) reported 3,084
sales during the first two weeks of February 2011 - a 13 per cent decrease
compared to the first two weeks of February 2010.

"We are on pace for a strong sales result in February, but transactions will
come in lower than the record result reported last February. Sales remain
strong because the GTA resale market contains a diversity of housing types
catering to a wide array of home ownership needs," said Toronto Real Estate
Board (TREB) President Bill Johnston.

The average price for transactions during the first 14 days of February was
$451,257, representing a five per cent increase compared to the first two
weeks of February 2010.

"Average selling price growth for existing homes is expected to range
between three and five per cent this year. Tighter market conditions over
the last four months have pushed price growth to the top end of this range,"
said Jason Mercer, TREB's Senior Manager of Market Analysis.

I hope this finds you Happy and Healthy!

All the Best!

Mark

A. Mark Argentino
P. Eng. Broker
Specializing in Residential & Investment Real Estate
RE/MAX Realty Specialists Inc.
Providing Full-Time Professional Real Estate Services since 1987
BUS 905-828-3434
FAX 905-828-2829 CELL 416-520-1577
mark@mississauga4sale.com
Mississauga4Sale.com

* Thinking of selling your home in the next 3 to 6 months? Would you
like a Complimentary & Quick Over-The-Net Home Evaluation ?
www.mississauga4sale.com/internet-evaluation.htm


* Power of Sales and Foreclosures
www.mississauga4sale.com/Power-Sales-Bank-Sales-Alert-Request.htm


* If you have not already signed up to receive my monthly real estate
newsletter, you may do so here: On-Line Real Estate Newsletter sign up
www.mississauga4sale.com/popupquestion.htm


* See seasonal housing patterns
www.mississauga4sale.com/TREBprice.htm


* Would you like me to send you a desk or wall Calendar?
www.mississauga4sale.com/Calendar-Order-Form.htm

By 2020 Average GTA house prices could be $638,000!


This graph shows the actual increase in residential sale prices in the GTA and the estimated prices based upon a 4% annual increase.

Current Average price for a single family home in the GTA is $427,000

Estimated average price by year 2015 is $525,000!

By 2020 average price estimate is $638,000!

Of course these are only estimates, but it shows that if the current trend continues prices will be well over $600,000 by 2020

Read more about this

Enjoy,
Mark

TREB MLS® Sales-to-New Listings Ratio Monthly with Three Previous Years for Comparison

This chart plots the monthly MLS® sales-to-new listings ratio (SNLR) for the current year and the previous three years. The recurring seasonal trend can be examined along with comparisons to previous years for each month. When the SNLR moves higher, annual average price growth generally increases –often at a rate well above inflation. When the SNLR moves lower, annual average price growth generally declines and can become negative.


Toronto Real Estate Board (TREB) Average Prices and GraphFor more information please contact A. Mark ArgentinoA. Mark Argentino, Broker, P.Eng.,Specializing in Residential & Investment Real EstateRE/MAX Realty Specialists Inc., Brokerage2691 Credit Valley Road, Suite 101, Mississauga, Ontario L5M 7A1BUS. 905-828-3434FAX. 905-828-2829E-MAIL: mark@mississauga4sale.comWebsite: Mississauga4Sale.com

Wednesday, February 16, 2011

Toronto Real Estate BoardTREB MLS® New ListingsMonthly with Three Previous Years for Comparison


This chart plots monthly MLS® new listings for the current year and the previous three years. The recurring seasonal trend can be examined along with comparisons to previous years for each month.


Toronto Real Estate Board (TREB) Average Prices and GraphFor more information please contact A. Mark ArgentinoA. Mark Argentino, Broker, P.Eng.,Specializing in Residential & Investment Real EstateRE/MAX Realty Specialists Inc., Brokerage2691 Credit Valley Road, Suite 101, Mississauga, Ontario L5M 7A1BUS. 905-828-3434FAX. 905-828-2829E-MAIL: mark@mississauga4sale.comWebsite: Mississauga4Sale.com

Tuesday, February 15, 2011

Canadian Real Estate Association has increased their predictions on the housing markets across Canada for 2011

The Canadian Real Estate Association has increased their predictions on the housing markets across Canada for 2011

I hope this finds you Happy and Healthy!


All the Best!


Mark


CREA Boosts Annual Resale Housing Forecast


OTTAWA – February 8, 2011 – The Canadian Real Estate Association (CREA) has revised its 2011 forecast for home sales activity via the Multiple Listing Service® (MLS®) Systems of Canadian real estate Boards and Associations, and extended it to 2012. Sales in the second half of 2010 rebounded faster than CREA had previously expected. “The hand-off going into 2011, together with the highs and lows for sales activity posted in 2010, provided guidance for CREA’s revised forecast,” said Gregory Klump, CREA Chief Economist.


“Home buyers recognize that low mortgage interest rates represent a once in a lifetime opportunity. At the same time, they expect that rates will rise, so they’re doing their homework in order to understand what it could mean in terms of higher mortgage payments down the road before they make an offer,” said Georges Pahud, CREA President. “The housing market and buyer psychology is different now than it was at the beginning of last year, so buyers and sellers would do well to consult their REALTOR® to understand local market trends.”


The upward revision to CREA’s forecast for 2011 reflects recent improvements in the consensus economic outlook and a further expected improvement in consumer confidence. National sales activity is now expected to reach 439,900 units in 2011, representing an annual decline of 1.6 per cent. In 2012, CREA forecasts that national sales activity will rebound by three per cent to 453,300 units, which is roughly on par with the ten year average.


“Recent additional changes to mortgage regulations will further ensure that buyers don’t buy more home than they can afford when interest rates inevitably rise,” said Klump. “The announcement of the new changes to mortgage regulations will likely bring forward some sales into the first quarter that would have otherwise occurred later in the year, particularly in some of Canada’s more expensive housing markets. This is expected to produce a milder version of the volatility in sales activity that we saw last year which resulted from additional transitory factors.”


Three transitory factors contributed to volatility in sales activity last year: changes in mortgage regulations announced last February, the early withdrawal by the Bank of Canada of its conditional commitment to keep interest rates on hold until the second half of 2010, and the introduction of the HST in BC and Ontario during the summer of 2010. CREA expects that home sales activity will gain traction after dipping in the second quarter as the economic recovery and job growth continue, incomes grow, and consumer confidence further improves. “Even though mortgage interest rates are expected to rise later this year, they will still be within short reach of current levels and remain supportive for housing market activity. Strengthening economic fundamentals will keep the housing market in balance, which will keep home prices stable,” said Klump. Page 2


The national average home price is forecast to rise 1.3 per cent in 2011 and 2012, to $343,300 and $347,900 respectively. Average price is expected to rise modestly in most provinces, reflecting the continuation of a healthy balance between supply of, and demand for, homes listed for sale. Although the supply of new listings is expected to trend higher, the expected continuation of sellers’ market conditions in Manitoba is forecast to result in a bigger percentage increase in average price in 2011 and 2012 compared to other provinces.


A. Mark
Argentino

P. Eng. Broker

Specializing in Residential & Investment Real Estate

RE/MAX
Realty Specialists Inc.
Providing Full-Time
Professional Real Estate Services since 1987

BUS
905-828-3434

FAX 905-828-2829
CELL 416-520-1577
mark@mississauga4sale.com
Mississauga4Sale.com


  • Thinking of selling your home in the next 3 to 6
    months? Would you like a Complimentary & Quick Over-The-Net Home
    Evaluation ?


    www.mississauga4sale.com/internet-evaluation.htm


  • Power of Sales and
    Foreclosures
    www.mississauga4sale.com/Power-Sales-Bank-Sales-Alert-Request.htm


  • If you have not already signed up to receive my
    monthly real estate newsletter, you may do so here: On-Line Real Estate
    Newsletter sign up

    www.mississauga4sale.com/popupquestion.htm


  • See seasonal housing
    patterns
    www.mississauga4sale.com/TREBprice.htm


  • Would you like me to send you a desk or wall
    Calendar?

    www.mississauga4sale.com/Calendar-Order-Form.htm


Toronto Real Estate Board (TREB) Average Prices and GraphFor more information please contact A. Mark ArgentinoA. Mark Argentino, Broker, P.Eng.,Specializing in Residential & Investment Real EstateRE/MAX Realty Specialists Inc., Brokerage2691 Credit Valley Road, Suite 101, Mississauga, Ontario L5M 7A1BUS. 905-828-3434FAX. 905-828-2829E-MAIL: mark@mississauga4sale.comWebsite: Mississauga4Sale.com

Assignment of Agreements of Purchase and Sale

This article below talks about assignment of an agreement and is much more
common with condominiums in our current marketplace.
Enjoy!
Mark


Assignment of Agreements of Purchase and Sale

An Assignment of an agreement of purchase and sale is not the transfer or
assignment of real property but rather an assignment or transfer of rights
arising out of the agreement or contract relating to
real property.

Assignments have become increasingly more common in the condominium sector.
However, in all builder contracts there is a restriction on the right of the
initial buyer to assign the agreement
of purchase or sale or contract without the builder's consent. Builders will
charge the buyer a fee for the consent to assign the contract to a new or
subsequent buyer.

When the agreement is assigned to the second buyer, this buyer will be
subject to both the benefits and obligations arising under the agreement
unless otherwise provided in the assignment agreement between the initial
buyer (the assignor) and the second/subsequent buyer (the assignee). As an
example, unless otherwise agreed to between the assignor and the assignee in
their assignment agreement, the assignee will receive the benefit of the
interest the builder credits the buyer on the deposits paid to the builder
as well as incur the expense of paying builder's closing costs such as the
Tarion Warranty premium, utility meters and connections and development
charges and educational levies.

We have provided the following checklist of issues to be considered when
preparing an assignment of agreement of purchase and sale:

1. Obtain a copy of the builder's agreement of purchase and sale;

2. What form of assignment agreement to be used;

3. What is the original purchase price;

4. What is the new purchase price

5. The amount of builder deposits already paid by the assignor; are
these deposits included in new purchase price or in addition to the purchase
price as a reimbursement to the assignor (the builder will provide a credit
for these deposits to the assignee on the final statement of adjustments)

6. What is the deposit amount on the assignment transaction and who
will hold the deposit - the agent/broker, the assignor's lawyer etc.

7. status of construction and closing dates - interim occupancy and
final closing dates;

8. the anticipated possession by the assignee - pre/post interim
closing date

9. the amount of the occupancy payment

10. postdated cheques for occupancy payments and other adjustments

11. the cost to obtain builder's consent and status of obtaining such
consent

12. who pays for the consent

13. builder's form of assumption/assignment agreement

14. who is paying the builder's closing costs

15. who is receiving credit for interest on the assignor's deposits
already paid to the builder

16. How is payment of purchase price made - amount down, any amount paid
prior to possession, amount paid upon the builder's consent being obtained;
amount paid on final closing etc.

17. Other Issues - Non-residency/withholding taxes - Assignor; GST/HST;
Tarion registration by Assignor; Capital Gains Tax - Assignor

For a copy of our pro forma assignment agreement and our annotated
assignment agreement, please email us at service@shapirocho.com or go to our
website at www.shapirocho.com.


I hope this finds you Happy and Healthy!

All the Best!

Mark

A. Mark Argentino
P. Eng. Broker
Specializing in Residential & Investment Real Estate
RE/MAX Realty Specialists Inc.
Providing Full-Time Professional Real Estate Services since 1987
BUS 905-828-3434
FAX 905-828-2829 CELL 416-520-1577
mark@mississauga4sale.com
Mississauga4Sale.com

* Thinking of selling your home in the next 3 to 6 months? Would you
like a Complimentary & Quick Over-The-Net Home Evaluation ?
www.mississauga4sale.com/internet-evaluation.htm


* Power of Sales and Foreclosures
www.mississauga4sale.com/Power-Sales-Bank-Sales-Alert-Request.htm


* If you have not already signed up to receive my monthly real estate
newsletter, you may do so here: On-Line Real Estate Newsletter sign up
www.mississauga4sale.com/popupquestion.htm


* See seasonal housing patterns
www.mississauga4sale.com/TREBprice.htm


* Would you like me to send you a desk or wall Calendar?
www.mississauga4sale.com/Calendar-Order-Form.htm

Monday, February 14, 2011

TREB MLS R Sales Monthly with Three Previous Years for Comparison


This chart plots monthly MLS(r) sales for the current year and the previous
three years. The recurring seasonal trend can be examined along with
comparisons to previous years for each month.

Tuesday, February 08, 2011

TD Canada Trust Economic News for Febtuary 8, 2011

This is the latest from TD Canada Trust, they are bearish on the new home
activity!
All the best,
Mark


TD Economics

February 8, 2011

Data Release: Homebuilding Activity Remained Steady in January

* Housing starts totaled 170K in January, roughly in line with the 174K unit
market expectations. This level of activity is largely unchanged from the
final numbers posted for December (169K).

* Breaking it down by type of housing, single-detached starts were down M/M
by 1,300 units to reach 64K in January. Multiple unit activity was down
M/M by this same amount to land at 83K units in January, on par with
December's tally.

* A subdued pace of activity was particularly noted in urban regions. In
January, urban activity decreased M/M by 2,600 units or 1.7%. Rural
activity, on the other hand, increased M/M by 4K units or 20.5%.

* At a regional level, there was no provincial standout in terms of big
winners or losers or a particular housing type showing acute weakness.
Ontario (+4.5K) and the Atlantic region (+1K) posted small M/M increases. At
the other end of the spectrum, the Prairies (-5.5K) and BC (-2K) saw M/M
declines.

Key Implications

* January's housing start numbers confirm that homebuilding has indeed
downshifted into second gear. The subdued pace of activity in both the new
and resale markets is indicative of a soft landing where markets are
stabilizing.

* Housing starts were 193K units in 2010, a level not seen since the market
heydays in 2008. Increasing household debt levels and mortgage rate
increases suggest that a return to the 2008 high water-mark is not in the
cards anytime soon. Rather, we anticipate activity to ease to 160K in 2011
and January's numbers are on track with our Q1 forecast. It will likely
take a few years before 2010 levels are once again revisited.

* Multiple unit activity has seen some significant swings in recent months.
This is in part because housing starts capture shovel-ready projects and
one condo site ready for construction can lead to a sizeable boost in the
month's tally. In spite of this volatility, we do expect multiple starts to
return to a more sustainable 75K annual average in 2011.

* In a separate Statistics Canada data release yesterday, the number of
residential building permits increased M/M by 3.7% in December. Although
this suggests that there is new activity in the pipeline, particularly for
multi-family units in Ontario, the lag between new permits and actual
housing starts can be long especially for large projects.

I hope this finds you Happy and Healthy!

All the Best!

Mark

A. Mark Argentino
P. Eng. Broker
Specializing in Residential & Investment Real Estate
RE/MAX Realty Specialists Inc.
Providing Full-Time Professional Real Estate Services since 1987
BUS 905-828-3434
FAX 905-828-2829 CELL 416-520-1577
mark@mississauga4sale.com
Mississauga4Sale.com

* Thinking of selling your home in the next 3 to 6 months? Would you
like a Complimentary & Quick Over-The-Net Home Evaluation ?
www.mississauga4sale.com/internet-evaluation.htm


* Power of Sales and Foreclosures
www.mississauga4sale.com/Power-Sales-Bank-Sales-Alert-Request.htm


* If you have not already signed up to receive my monthly real estate
newsletter, you may do so here: On-Line Real Estate Newsletter sign up
www.mississauga4sale.com/popupquestion.htm


* See seasonal housing patterns
www.mississauga4sale.com/TREBprice.htm


* Would you like me to send you a desk or wall Calendar?
www.mississauga4sale.com/Calendar-Order-Form.htm

Real Estate experienced significant gains over the past 10 years

This is the latest report from RE/MAX and shows that our marketplace has
experienced significant gains over the past 10 years


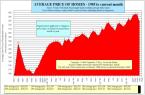
See the graph on my site showing the previous 10 to 15 year run-up of real
estate prices


http://www.mississauga4sale.com/TREBavg1995date.htm


Enjoy!


Mark


'Wild card' props up Canadian housing markets over past decade, says RE/MAX


Inventory remains key to stability in 2011

Tighter inventory levels helped to make the last decade one of the
healthiest periods on record for Canadian real estate, insulating markets in
major centres from the peaks and valleys characteristic of past decades,
according to a report released today by RE/MAX.

The RE/MAX Housing Barometer Report measured monthly sales-to-new listings
ratios in 18 major centres across the country from January 2000 to December
2010. The report found strong seller's/balanced conditions prevailed for
much of the time frame, prompting significant gains in housing values. The
lone exception was when the market dipped into buyer's territory during the
latter half of 2008 and early 2009. However, fewer listings served to
offset diminished demand and provided greater stability. Average price
increases from 2000 to 2010 ranged from an annually compounded rate of
return of 4.82 per cent in London-St. Thomas to a high of 9.56 per cent in
Regina. Quebec City and Greater Montreal saw a return of 9.2 per cent and
8.48 per cent respectively. The national average was 6.82 per cent. By far
the tightest market in the nation was Winnipeg, where seller's ruled the
roost for 85 per cent of the decade, followed by Hamilton-Burlington (67 per
cent), Regina (63.6 per cent), Kitchener-Waterloo (59.8 per cent) and
Edmonton (57.5 per cent).

"There's no question that price appreciation has been solid over the past
decade, in large part due to tight supply, but history tells us that
exceptional growth supported by sound fundamentals is healthy," says Sylvain
Dansereau, Executive Vice President, RE/MAX Quebec. "Concern is only raised
when the underpinnings are insufficient to justify the trajectory. Canada's
real estate markets measure up to conventional wisdom. Quebec markets, in
particular, have performed exceptionally well since 2000, bolstered by job
security, lower interest rates, and a growing belief in homeownership. The
next decade is expected to bring more of the same, with inventory once again
playing a key role."

A number of city centres are already reporting stronger than usual housing
activity out of the gate, with first-time buyers comprising the vast
majority of purchasers and move-up buyers in close pursuit. Quebec markets
are no exception. Demand and supply are on relatively even keel at present
in most areas, but the traditionally busy spring season is expected to keep
the market at a perfect equilibrium in the days and months ahead. However,
there may be some exceptions to the rule. The country's largest markets-
Greater Montreal , Greater Toronto , and Greater Vancouver-are expected to
head into the second quarter with fewer listings overall. Two
centres-Newfoundland & Labrador and Kelowna-are still firmly entrenched in
buyer's markets.

"Inventory has always been the wild card," says Michael Polzler, Executive
Vice President, RE/MAX Ontario-Atlantic Canada. "Its influence is
remarkable, but a number of other factors will serve to bolster Canadian
real estate moving forward including land scarcity, intensification,
immigration, continued infrastructure and capital spending, improving money
markets and the rebounding economy. The threat of rising interest rates and
the changes to mortgage lending may also prompt a flurry of activity
affecting price growth in the weeks ahead. Yet, overall, gains in 2011 will
be more moderate than those noted in the past decade."

Western Canada experienced some of the highest rates of return for real
estate over the 11-year period. While values in Regina posted the greatest
percentage increase (9.56 per cent), Edmonton, (9.25 per cent), Saskatoon
(9.2 per cent), Winnipeg (9.01 per cent), Kelowna (8.42 per cent), Greater
Vancouver (7.8 per cent), Calgary (7.7 per cent) and Victoria (7.59 per
cent) all outperformed the national average.

Equally strong gains were posted in Quebec. While solid balanced market
conditions prevailed for much of the decade, housing values in Quebec City
and Montreal rose 9.2 and 8.48 per cent respectively on an annually
compounded basis.

Increases were more moderate in Ontario and Atlantic Canada-with the
exception of Newfoundland & Labrador, where values escalated 8.14 per cent
on average. Ottawa led in terms of price appreciation in Ontario at 6.78
per cent, followed by Hamilton-Burlington at six per cent,
Kitchener-Waterloo at 5.69 per cent, the Greater Toronto Area at 5.35 per
cent, and London-St. Thomas at 4.82 per cent.

"An improved global economic picture, lower unemployment rates and rising
consumer confidence have buoyed home buying activity since November," says
Elton Ash, Regional Executive Vice President, RE/MAX of Western Canada.
"While sales figures are expected to be slightly off 2010's heated pace,
housing values are forecast to continue to climb in Canadian real estate
markets in 2011-with most a direct result of lower listing levels."

While the statistics are impressive, they alone cannot tell the tale. The
gains realized over the past decade speak to the tremendous resiliency of
the Canadian residential housing market. Considering catastrophic events,
both natural and manmade, that occurred throughout the period-SARS, forest
fires, ice storms, 9/11, a recession-the performance of the real estate
sector proved that much more significant. It remained a consistent bright
spot supporting economic growth and ancillary spending, and subsequently
helped lead the nation out of the greatest downturn in recent memory-its
hardy nature heightening its appeal as a long-term investment.

RE/MAX is Canada's leading real estate organization with over 18,000 sales
associates situated throughout its more than 690 independently-owned and
operated offices in Canada. The RE/MAX network, now in its 38th year, is a
global real estate system operating in 80 countries, with over 6,300
independently-owned offices and over 92,000 member sales associates. RE/MAX
realtors lead the industry in professional designations, experience and
production while providing real estate services in residential, commercial,
referral, and asset management.

I hope this finds you Happy and Healthy!

All the Best!

Mark

A. Mark Argentino
P. Eng. Broker
Specializing in Residential & Investment Real Estate
RE/MAX Realty Specialists Inc.
Providing Full-Time Professional Real Estate Services since 1987
BUS 905-828-3434
FAX 905-828-2829 CELL 416-520-1577
mark@mississauga4sale.com
Mississauga4Sale.com

* Thinking of selling your home in the next 3 to 6 months? Would you
like a Complimentary & Quick Over-The-Net Home Evaluation ?
www.mississauga4sale.com/internet-evaluation.htm


* Power of Sales and Foreclosures
www.mississauga4sale.com/Power-Sales-Bank-Sales-Alert-Request.htm


* If you have not already signed up to receive my monthly real estate
newsletter, you may do so here: On-Line Real Estate Newsletter sign up
www.mississauga4sale.com/popupquestion.htm


* See seasonal housing patterns
www.mississauga4sale.com/TREBprice.htm


* Would you like me to send you a desk or wall Calendar?
www.mississauga4sale.com/Calendar-Order-Form.htm

Monday, February 07, 2011

Canada's economy being much more stable than US

Hello,

I thought I would share this excellent article with you below about Canada's economy being much more stable than US

It must have been written by a Canadian or at least a Canadian sympathizer!

Here is a Great quote from the article...

" "Look what's not happening in Canada. There is no real estate crisis. There is no banking crisis. There is no unemployment crisis. There is no sovereign debt crisis. Recent reports suggest that consumers are loading up too much debt, but Canada shares that problem with nearly every other country in the industrialized world."

"

and so true, there is no real estate crisis in Canada. And if there is or was a recession in the GTA over the past couple of years, it sure didn't affect real estate prices.

Have a great day,
Mark


Toronto Real Estate Board (TREB) Average Prices and GraphFor more information please contact A. Mark ArgentinoA. Mark Argentino, Broker, P.Eng.,Specializing in Residential & Investment Real EstateRE/MAX Realty Specialists Inc., Brokerage2691 Credit Valley Road, Suite 101, Mississauga, Ontario L5M 7A1BUS. 905-828-3434FAX. 905-828-2829E-MAIL: mark@mississauga4sale.comWebsite: Mississauga4Sale.com

Friday, February 04, 2011

GTA Real Estate Market results for January 2011

This is the latest report from the Toronto Real Estate Board on prices for January 2011

GTA REALTORS® Report Monthly Resale Housing Market Figures TORONTO, February 4, 2011

Greater Toronto REALTORS® reported 4,337 transactions through the TorontoMLS® system in January 2011.

This result was 13 per cent lower than the record result reported in January 2010.

“While off the record pace experienced a year ago, the GTA resale market has started the year on a solid footing. Home buyers in Toronto and surrounding areas continue to benefit from a diversity of housing types for sale at many different price points,” said TREB President Bill Johnston.

The average selling price for January 2011 sales was $427,037, representing an increase of over four per cent compared to the average of $409,058 reported in January 2010.

“The average selling price is expected to grow at a moderate pace in 2011. Growth rates in the three to five per cent range will be sustainable from an affordability perspective,” said Jason Mercer, TREB’s Senior Manager of Market Analysis

I hope this finds you happy and healthy!
Mark


Toronto Real Estate Board (TREB) Average Prices and GraphFor more information please contact A. Mark ArgentinoA. Mark Argentino, Broker, P.Eng.,Specializing in Residential & Investment Real EstateRE/MAX Realty Specialists Inc., Brokerage2691 Credit Valley Road, Suite 101, Mississauga, Ontario L5M 7A1BUS. 905-828-3434FAX. 905-828-2829E-MAIL: mark@mississauga4sale.comWebsite: Mississauga4Sale.com

Wednesday, February 02, 2011

TD Canada Trust Economic News - February 1

Good morning,

This is the latest news from TD Canada trust. They think there will be some
cooling in the real estate market and expect real estate growth to be
moderate, at best!

Enjoy the snow today!
Mark


TD Economics

Data Release: Canadian Real GDP surprises on the upside in November
* Canadian real GDP rose 0.4% in November, almost double the pace markets were expecting, and the strongest growth rate in almost nine months. The headline number likely masked underlying trends, as plant reopening in the mining and oil and gas (+1.3%) industry bolstered real GDP growth, while restructuring in the auto industry (-15.6%) weighed heavily on growth in the month. Looking beyond temporary factors, on a year-over-year basis, real GDP growth cooled to 3.0%, from 3.4% in the prior month, continuing a 9-month moderating trend.

* Outside of temporary factors, signs of strength emanated from the service sector (+0.5%), with strong gains in retail trade (+1.4%), and finance insurance, and real estate (0.6%). Both have come roaring back, following a 9-month breather following the robust strength seen in late 2009, and early 2010. The gains in finance, insurance and real estate can likely be linked to the renewed strength in the existing home market experienced in late 2010. Gains in other services were much more muted in the month.

* Excluding the temporary drop in motor vehicle production, the goods producing sector weighed heavily on growth in the month. Construction (-0.4%) fell for a second consecutive month, driven by weakness in new home building. Manufacturing excluding auto production (-0.2%) was lackluster in the month. Manufacturing output has fallen in four of the last five months, as this sector struggles to pull its way out of the rubble caused by the 2008/2009 recession.

Key Implications

* November's gain puts real GDP growth on track for 2.3% in the fourth quarter of 2010, in line with our and the Bank of Canada's expectations. This underscores our view that the drop in real GDP growth to 1.0% was temporary, and the Canadian economy should continue at a slightly faster, but still gradual pace over the next year.

* We anticipate that the strength in the service sector may be short-lived. The service sectors continued to benefit from strong domestic demand, and extremely low interest rates, led by the Canadian existing housing market. Since, we have seen signs of cooling on that front, and going forward we expect housing activity to be moderate at best. In addition, the most recent changes to mortgage insurance rules should work to dampen demand in the existing home market. A cooling housing market, coupled with high household debt levels is likely to slow growth in the service sector and construction output through 2011.

* Meanwhile, the goods sector should continue to benefit from strong global demand for Canadian resources, such oil and gas. But excluding the resource sector, manufacturing will continue to face significant challenges, particularly in the wake of a strong Canadian dollar, and increased competition from low-cost global players.

I hope this finds you Happy and Healthy!

All the Best!

Mark

A. Mark Argentino
P. Eng. Broker
Specializing in Residential & Investment Real Estate
RE/MAX Realty Specialists Inc.
Providing Full-Time Professional Real Estate Services since 1987
BUS 905-828-3434
FAX 905-828-2829 CELL 416-520-1577
mark@mississauga4sale.com
Mississauga4Sale.com

* Thinking of selling your home in the next 3 to 6 months? Would you
like a Complimentary & Quick Over-The-Net Home Evaluation ?
www.mississauga4sale.com/internet-evaluation.htm


* Power of Sales and Foreclosures
www.mississauga4sale.com/Power-Sales-Bank-Sales-Alert-Request.htm


* If you have not already signed up to receive my monthly real estate
newsletter, you may do so here: On-Line Real Estate Newsletter sign up
www.mississauga4sale.com/popupquestion.htm


* See seasonal housing patterns
www.mississauga4sale.com/TREBprice.htm


* Would you like me to send you a desk or wall Calendar?
www.mississauga4sale.com/Calendar-Order-Form.htm