Showing posts with label TREB-average-prices-toronto-2010. Show all posts

Wednesday, December 29, 2010

TREB Affordability Indicator Share of Average Household Income Used for Mortgage Principal and Interest, Property Taxes and Utilities on the Avg


This chart plots the share of average household income that goes toward mortgage principal and interest, property taxes and utilities for the average priced home in the GTA subject to the following assumptions:
1.Average annual or year-to-date home price as reported by TREB
2.20 per cent down payment
3.Average 5-year fixed mortgage rate (Statistics Canada); 25-year amortization
4.Average property tax rate reported by/estimated from the Statistics Canada Survey of Household Spending
5.Average utilities cost reported by/estimated from the Statistics Canada Survey of Household Spending and components of the Consumer Price Index
6.Average household income reported by the Census of Canada. Years in between Censuses estimated using interpolation (years upto2005) or annual growth in average weekly earnings reported by Statistics Canada in the LabourForce Survey (2006 onward).

Toronto Real Estate Board Data and Calculation; Statistics CanadaTREB


Toronto Real Estate Board (TREB) Average Prices and GraphFor more information please contact A. Mark ArgentinoA. Mark Argentino, Broker, P.Eng.,Specializing in Residential & Investment Real EstateRE/MAX Realty Specialists Inc., Brokerage2691 Credit Valley Road, Suite 101, Mississauga, Ontario L5M 7A1BUS. 905-828-3434FAX. 905-828-2829E-MAIL: mark@mississauga4sale.comWebsite: Mississauga4Sale.com

Tuesday, December 28, 2010

TREB MLS® Sales-to-New Listings Ratio Compared to Average Annual Per Cent Change in Home Price Sales


This chart plots the monthly sales-to-new listings ratio (blue line) with year-over-year average annual per cent price change (brown line). When the sales-to-new listings ratio moves higher, average annual per cent change in home prices generally trends higher. When the sales-to-new listings ratio moves lower, average annual per cent change in home prices generally trends lower.


Toronto Real Estate Board (TREB) Average Prices and GraphFor more information please contact A. Mark ArgentinoA. Mark Argentino, Broker, P.Eng.,Specializing in Residential & Investment Real EstateRE/MAX Realty Specialists Inc., Brokerage2691 Credit Valley Road, Suite 101, Mississauga, Ontario L5M 7A1BUS. 905-828-3434FAX. 905-828-2829E-MAIL: mark@mississauga4sale.comWebsite: Mississauga4Sale.com

Monday, December 27, 2010

TREB MLS® Average Price Monthly Time Series with Trend Line Actual


This chart plots monthly MLS® average price since January 1995. The blue line shows the actual average price. The brown line is the trend computed using a 12-month moving average, which exhibits no seasonal variations or other irregular fluctuations. A substantial change in actual average price must occur to change the direction of the trend.


Toronto Real Estate Board (TREB) Average Prices and GraphFor more information please contact A. Mark ArgentinoA. Mark Argentino, Broker, P.Eng.,Specializing in Residential & Investment Real EstateRE/MAX Realty Specialists Inc., Brokerage2691 Credit Valley Road, Suite 101, Mississauga, Ontario L5M 7A1BUS. 905-828-3434FAX. 905-828-2829E-MAIL: mark@mississauga4sale.comWebsite: Mississauga4Sale.com

Thursday, December 23, 2010

TREB MLS® New Listings Monthly Time Series with Trend Line Actual


This chart plots monthly MLS® new listings since January 1995. The blue line shows actual new listings. The brown line is the trend computed using a 12-month moving average, which exhibits no seasonal variations or other irregular fluctuations. A substantial change in actual new listings must occur to change the direction of the trend.


Toronto Real Estate Board (TREB) Average Prices and GraphFor more information please contact A. Mark ArgentinoA. Mark Argentino, Broker, P.Eng.,Specializing in Residential & Investment Real EstateRE/MAX Realty Specialists Inc., Brokerage2691 Credit Valley Road, Suite 101, Mississauga, Ontario L5M 7A1BUS. 905-828-3434FAX. 905-828-2829E-MAIL: mark@mississauga4sale.comWebsite: Mississauga4Sale.com

Tuesday, December 21, 2010

TREB MLS® New Listings Monthly Time Series with Trend Line Actual


This chart plots monthly MLS® new listings since January 1995. The blue line shows actual new listings. The brown line is the trend computed using a 12-month moving average, which exhibits no seasonal variations or other irregular fluctuations. A substantial change in actual new listings must occur to change the direction of the trend.


Toronto Real Estate Board (TREB) Average Prices and GraphFor more information please contact A. Mark ArgentinoA. Mark Argentino, Broker, P.Eng.,Specializing in Residential & Investment Real EstateRE/MAX Realty Specialists Inc., Brokerage2691 Credit Valley Road, Suite 101, Mississauga, Ontario L5M 7A1BUS. 905-828-3434FAX. 905-828-2829E-MAIL: mark@mississauga4sale.comWebsite: Mississauga4Sale.com

Monday, December 20, 2010

TREB MLS® Sales Monthly Time Series with Trend Line Actual


This chart plots monthly MLS® sales since January 1995. The blue line shows actual sales. The brown line is the trend computed using a 12-month moving average, which exhibits no seasonal variations or other irregular fluctuations. A substantial change in actual sales must occur to change the direction of the trend.


Toronto Real Estate Board (TREB) Average Prices and GraphFor more information please contact A. Mark ArgentinoA. Mark Argentino, Broker, P.Eng.,Specializing in Residential & Investment Real EstateRE/MAX Realty Specialists Inc., Brokerage2691 Credit Valley Road, Suite 101, Mississauga, Ontario L5M 7A1BUS. 905-828-3434FAX. 905-828-2829E-MAIL: mark@mississauga4sale.comWebsite: Mississauga4Sale.com

Wednesday, December 08, 2010

Prices up sales down for November 2010 GTA Resale Housing Market

Hello,

The December real estate report for November was just released. Comparing November 2010 to November 2009 homes sales were down about 13% and the average price is up 5% for the same period.

We expect that the next month or so will see a 'typical' market, which is slower than most other months of the year.

See the report below.

I hope this finds you healthy and happy,
Mark


GTA REALTORS(r) Report Monthly Resale Housing Market Figures

TORONTO, December 3, 2010 -- Greater Toronto REALTORS reported 6,510 existing home sales in November - down 13 per cent from 7,446 sales in November 2009. New listings were also down 13 per cent annually to 8,642.

On a month-over-month basis, the seasonally adjusted annual rate of sales increased for the fourth straight month to 88,100. This rate was substantially higher than the July low of 67,900.

"The GTA resale market has tightened since the summer. Healthy market conditions continued to support growth in the average selling price," said Toronto Real Estate Board President Bill Johnston.

"Sales through the first 11 months of the year were down only marginally compared to the same period in 2009. We remain on track for one of the best years on record under the current TREB market area," continued Johnston.

The average selling price for November transactions was $438,030 - up five per cent compared to November 2009.

"The average selling price in the GTA is affordable. A household earning the average income can comfortably cover the mortgage payments on an average priced home. Expect the average selling price to grow at a moderate pace in the next while.

Thursday, November 18, 2010

Mid November 2010 sales down but prices up for GTA Resale Housing Market Figures

Sales figures for mid month are in. Comparing November 2010 to November 2009 the number of sales is down about 16% Year to date sales are up slightly.

Average price for November 2010 is $437,554 which is about 5% HIGHER than same period in 2009

The full article is below...


GTA REALTORS(r) Report Mid-Month Resale Housing Market Figures

TORONTO, November 16, 2010 -- Greater Toronto REALTORS(r) reported 3,076 sales through the Multiple Listing Service(r) (MLS(r)) during the first two weeks of November 2010.

This represented a 16 per cent decrease compared to the 3,666 sales recorded during the same period in November 2009. Year-to-date sales amounted to 78,526 - up slightly from the 2009 total.

"The number of transactions remained high relative to new listings through the first half of November, promoting a healthy rate of price growth compared to last year," said Toronto Real Estate Board President Bill Johnston.

The average price for November mid-month transactions was $437,554 - up more than five per cent compared to the average of $415,066 recorded during the first 14 days of November 2009.

"Mortgage payments on the average priced home remain affordable in the GTA based.

This is why the average selling price continues to increase," said Jason Mercer, TREB's Senior Manager of Market Analysis.


I hope this finds you Happy and Healthy!

All the Best!

Mark

A. Mark Argentino
P. Eng. Broker
Specializing in Residential & Investment Real Estate
RE/MAX Realty Specialists Inc.
Providing Full-Time Professional Real Estate Services since 1987
BUS 905-828-3434
FAX 905-828-2829 CELL 416-520-1577
mark@mississauga4sale.com
Mississauga4Sale.com

* Thinking of selling your home in the next 3 to 6 months? Would you
like a Complimentary & Quick Over-The-Net Home Evaluation ?
www.mississauga4sale.com/internet-evaluation.htm


* Power of Sales and Foreclosures
www.mississauga4sale.com/Power-Sales-Bank-Sales-Alert-Request.htm


* If you have not already signed up to receive my monthly real estate
newsletter, you may do so here: On-Line Real Estate Newsletter sign up
www.mississauga4sale.com/popupquestion.htm


* See seasonal housing patterns
www.mississauga4sale.com/TREBprice.htm


* Would you like me to send you a desk or wall Calendar?
www.mississauga4sale.com/Calendar-Order-Form.htm

Tuesday, November 09, 2010

GTA real estate market is healthy

This is the latest report from TREB for last month. It shows that the current GTA Real Estate Market is healthy.

October Price Growth Reflects Healthy Housing Market Conditions

November 3, 2010 -- Greater Toronto REALTORS(r) reported 6,681 sales through the Multiple Listing Service(r) (MLS(r)) in October 2010. This represented a 21 per cent decrease compared to the 8,476 sales recorded in October 2009.

Through the first ten months of the year, sales amounted to 75,582 - up one per cent compared to the January through October period in 2009.

"The annual change in sales and average selling prices has been quite uniform across the GTA and by property type as the market has balanced out from record levels of sales in the second half of 2009 and first few months of 2010," said Toronto Real Estate Board (TREB) President Bill Johnston.

"The composition of GTA home sales does differ depending on location.

Condominium apartments accounted for 42 per cent of total sales in the City of Toronto and almost 60 per cent of sales in TREB's central districts," Johnston continued. "In regions surrounding the City of Toronto, in contrast, low rise home types accounted for almost 90 per cent of transactions."

The average price for October transactions was $443,729 - up five per cent compared to the average of $423,559 reported in October 2009. The average selling price through the first nine months of the year was $430,802.

"The average selling price in the GTA has continued to grow relative to 2009 because home ownership has remained affordable," said Jason Mercer, the Toronto Real Estate Board's Senior Manager of Market Analysis. "A household earning the average income in the GTA can comfortably afford the mortgage payments associated with the purchase of an average priced home."

"The outlook for mortgage rates and income growth over the next year is favorable. The average home selling price could increase moderately next year and remain affordable for the average GTA household," continued Mercer.

Median Price
In October, the median price was $366,000, from the $357,000 recorded during October of 2009.

I hope this finds you Happy and Healthy!

All the Best!

Mark

A. Mark Argentino
P. Eng. Broker
Specializing in Residential & Investment Real Estate
RE/MAX Realty Specialists Inc.
Providing Full-Time Professional Real Estate Services since 1987
BUS 905-828-3434
FAX 905-828-2829 CELL 416-520-1577
mark@mississauga4sale.com
Mississauga4Sale.com

* Thinking of selling your home in the next 3 to 6 months? Would you
like a Complimentary & Quick Over-The-Net Home Evaluation ?
www.mississauga4sale.com/internet-evaluation.htm


* Power of Sales and Foreclosures
www.mississauga4sale.com/Power-Sales-Bank-Sales-Alert-Request.htm


* If you have not already signed up to receive my monthly real estate
newsletter, you may do so here: On-Line Real Estate Newsletter sign up
www.mississauga4sale.com/popupquestion.htm


* See seasonal housing patterns
www.mississauga4sale.com/TREBprice.htm


* Would you like me to send you a desk or wall Calendar?
www.mississauga4sale.com/Calendar-Order-Form.htm

Tuesday, October 05, 2010

September real estate housing market in the GTA

This is the latest press release from TREB regarding the September real estate market in the GTA


GTA REALTORS(r) Report Monthly Resale Housing Market Figures

TORONTO, October 5, 2010 -- Greater Toronto REALTORS(r) reported 6,310 sales through the Multiple Listing Service(r) (MLS(r)) in September 2010.

This represented a 23 per cent decrease compared to the 8,196 sales recorded during the same period in 2009. Through the first nine months of the year, sales amounted to 69,069 - up four per cent compared to the first three quarters of 2009.

"The level of sales in the second half of 2010 has been lower, representing a balancing out period following record levels of sales in the latter half of 2009 and first few months of 2010. We remain on track for one of the best years in history for existing home transactions in the GTA," said Toronto Real Estate Board President Bill Johnston.

The average price for September transactions was $427,329- up five per cent compared to the average of $406,877 reported in September 2009. The average selling price through the first nine months of the year was $429,657.

"Resale homes in the GTA remain affordable," said Jason Mercer, TREB's Senior Manager of Market Analysis.

"It is important to consider the positive impact of declining mortgage rates over the past two decades. Simply considering home prices relative to incomes does not allow for an accurate analysis of affordability," continued Mercer.

"The share of average household income going toward a mortgage payment on the average priced home in the GTA remains within accepted lending guidelines. This is why the average home selling price has continued to grow."


I hope this finds you Happy and Healthy!

All the Best!

Mark

A. Mark Argentino
P. Eng. Broker
Specializing in Residential & Investment Real Estate
RE/MAX Realty Specialists Inc.
Providing Full-Time Professional Real Estate Services since 1987
BUS 905-828-3434
FAX 905-828-2829 CELL 416-520-1577
mark@mississauga4sale.com
Mississauga4Sale.com

* Thinking of selling your home in the next 3 to 6 months? Would you
like a Complimentary & Quick Over-The-Net Home Evaluation ?
www.mississauga4sale.com/internet-evaluation.htm


* Power of Sales and Foreclosures
www.mississauga4sale.com/Power-Sales-Bank-Sales-Alert-Request.htm


* If you have not already signed up to receive my monthly real estate
newsletter, you may do so here: On-Line Real Estate Newsletter sign up
www.mississauga4sale.com/popupquestion.htm


* See seasonal housing patterns
www.mississauga4sale.com/TREBprice.htm


* Would you like me to send you a desk or wall Calendar?
www.mississauga4sale.com/Calendar-Order-Form.htm

Tuesday, September 28, 2010

RE: Graph - Average Price of Homes 1987 to Present


I received an email with good questions about the average price graphs and will post the question and my answer below.


Mark


_____


From: Ronald S.]
Sent: Wednesday, September 22, 2010 11:37 AM
To: mark@mississauga4sale.com
Subject: Graph - Average Price of Homes 1987 to Present


Hello Mark,

The information preceding the graph indicates that it relates to single family homes. Does that include condominiums? If so, is there a graph that excludes them? I understand that condominiums dropped more sharply than detached homes in the early 1990s, and it would be interesting to see that separately.

Regards,

Ron S.


Hello Ron,

Yes, single family includes condominiums, all housing types that are single family. See the housing types and breakdown for last month in the table below, as an example.

Let me see if I can find the data for the same period for only condominiums.


From what I have seen in the past, there will be no breakdown for only condos. Each area and district is broken down for each housing type, but it would be a monstrous task to go through each monthly issue for each year to gather the data for each area and then put them all together. I'll see what I can find out and get back to you if I find something.

Thank you for your comments and questions,
Mark


Monday, September 27, 2010

TREB west districts days on the market

this graph shows the TREB west districts days on the market and indicates
that compared to the last year it is taking slightly longer to sell a home
in the west districts of the GTA

Friday, September 24, 2010

Graph showing the TREB average prices over the past 10 years

This is a graph showing the TREB average prices over the past 10 years and
clearly indicates that prices have increased steadily for the past year
since 2000

Whether this trend continues or not is yet to be seen!
I hope this finds you Happy and Healthy!

All the Best!

Mark

A. Mark Argentino
P. Eng. Broker
Specializing in Residential & Investment Real Estate

Thursday, September 23, 2010

TREB average prices month by month since January of 2009 to August of 2010

This chart shows the TREB average prices month by month since January of
2009 to August of 2010 and clearly shows that prices have increased
substantially over the past 20 months or so and that there is a cycle of
price increases throughout the year
I hope this finds you Happy and Healthy!

All the Best!

Mark

A. Mark Argentino
P. Eng. Broker
Specializing in Residential & Investment Real Estate

Wednesday, September 22, 2010

TREB West districts sales to active listings

this graph shows the TREB West districts sales to active listings and
indicates that about 38% of all active listings are currently selling, this
is down compared to the previous 12 months, indicating that our current GTA
west marketplace is softer compared to a year ago
I hope this finds you Happy and Healthy!

All the Best!

Mark

A. Mark Argentino
P. Eng. Broker
Specializing in Residential & Investment Real Estate

Tuesday, September 21, 2010

TREB number of active listings on the market

This graph shows that the TREB number of active listings on the market is up
compared to last year but not as high as it was during the summer months
I hope this finds you Happy and Healthy!

All the Best!

Mark

A. Mark Argentino
P. Eng. Broker
Specializing in Residential & Investment Real Estate

Monday, September 20, 2010

Toronto and GTA first half results for September 2010 Housing Figures for resale homes

Sales for the first half of September 2010 are slightly better compared to first two weeks of September 2009. Prices are up 5% compared to the same period, thus we seem to be experiencing a healthy marketplace this year, regardless of the negative press.

Full report with sales stats are below

All the best,

Mark

GTA REALTORS(r) Report Mid-Month Resale Housing Figures

TORONTO, September 16, 2010 ‐ Greater Toronto REALTORS(r) reported 2,623 sales through the Multiple Listing Service(r) (MLS(r)) during the first two weeks of September 2010. This represented a 22 per cent decrease compared to the 3,361 sales recorded during the same period in 2009. Year-to-date sales amounted to 65,455, representing a six per cent increase compared to 2009.

"Sales remain below the record pace we experienced in the second half of 2009. The prospect of higher interest rates and new mortgage lending guidelines resulted in higher than normal sales in the first few months of the year.

To balance this out, the pace of sales has slowed in the second half," said Toronto Real Estate Board President Bill Johnston.

"It is important to note that year-to-date sales remain above the number reported through the same period last year," added Johnston.

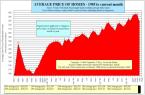
The average price for September mid-month transactions was $412,367 - up five per cent compared to the average of $393,818 recorded during the first 14 days of September 2009.

"Under current lending standards, the average selling price is affordable for a household earning the average income in the GTA. The annual price growth we have been experiencing has been justified by this positive affordability picture," said Jason Mercer, TREB's Senior Manager of Market Analysis.

Summary Of September Sales And Average Price

September

2010 2009

Sales Average Price Sales Average Price

City of Toronto ("416") 978 $435,643 1,280 $415,126

Rest of GTA ("905") 1,645 $398,529 2,081 $380,712

GTA 2,623 $412,367 3,361 $393,818

Source: Toronto Real Estate Board

Sales & Average Price By Home Type

September‐2010

Sales Average Price

416 905 Total 416 905 Total

Detached 312 919 1,231 621,706 476,329 513,326

Yr./Yr. % Change ‐22% ‐22% ‐22% 8% 6% 7%

Semi‐Detached 102 195 297 460,878 339,515 381,195

Yr./Yr. % Change ‐29% ‐14% ‐20% 0% 3% 0%

Townhouse 99 287 386 402,683 298,204 325,000

Yr./Yr. % Change ‐35% ‐28% ‐30% 14% 1% 5%

Condo Apartment 457 203 660 311,897 247,145 291,981

Yr./Yr. % Change ‐20% ‐11% ‐17% 0% 2% 0%

Source: Toronto Real Estate Board

I hope this finds you Happy and Healthy!

All the Best!

Mark

A. Mark Argentino
P. Eng. Broker
Specializing in Residential & Investment Real Estate
RE/MAX Realty Specialists Inc.
Providing Full-Time Professional Real Estate Services since 1987
BUS 905-828-3434
FAX 905-828-2829 CELL 416-520-1577
mark@mississauga4sale.com
Mississauga4Sale.com

* Thinking of selling your home in the next 3 to 6 months? Would you
like a Complimentary & Quick Over-The-Net Home Evaluation ?
www.mississauga4sale.com/internet-evaluation.htm


* Power of Sales and Foreclosures
www.mississauga4sale.com/Power-Sales-Bank-Sales-Alert-Request.htm


* If you have not already signed up to receive my monthly real estate
newsletter, you may do so here: On-Line Real Estate Newsletter sign up
www.mississauga4sale.com/popupquestion.htm


* See seasonal housing patterns
www.mississauga4sale.com/TREBprice.htm


* Would you like me to send you a desk or wall Calendar?
www.mississauga4sale.com/Calendar-Order-Form.htm

Sunday, September 19, 2010

TREB overall number of sales each month past year

This graph shows the TREB overall number of sales each month past year and
indicates that there is clearly a cyclical pattern throughout the year for
the number of sales, up in the spring, lower in the summer, up again in the
fall and lower in the winter, we expect the fall of 2010 to be typical of
previous years sales
I hope this finds you Happy and Healthy!

All the Best!

Mark

A. Mark Argentino
P. Eng. Broker
Specializing in Residential & Investment Real Estate

Thursday, September 16, 2010

TREB MLS Sales to new listings ratio, monthly with three previous years for comparison

This chart plots the monthly MLS sales to new listings ratio for the current
year and the previous three years. The recurring season trend can be
examined along with comparisons to previous years for each month. Then the
sales to new listings ratio moves higher the annual average price growth
generally increases, often at a rate well above inflations. The the sales
to new listings ratio moves lower the annual average price growth generally
declines and can become negative.

I hope this finds you Happy and Healthy!

All the Best!

Mark

A. Mark Argentino
P. Eng. Broker
Specializing in Residential & Investment Real Estate

Wednesday, September 15, 2010

Shift in GTA home prices August 2010 compared to 2008

This chart shows the percentage of sales in each price range from August 2008

This chart shows the percentage of sales in each price range from August 2010

This is a graphical representation showing the percentage of homes that sold
in each price range.

Note the shift when you compare this month to 2 years ago, quite
significant!

Enjoy!

Mark

Thank you for reading my blog and if there is anything else I can help you
with please don't hesitate to contact me,

Mark

A. Mark Argentino
P. Eng. Broker
Specializing in Residential & Investment Real Estate