Showing posts with label TREB-average-prices-toronto-2012. Show all posts

Thursday, December 20, 2012

Predicting the GTA and Mississauga Real estate market is for fortune tellers and psychics!


Predicting the GTA and Mississauga real estate market future is for fortune tellers and psychics!

All we can really do is analyze the past markets, ascertain trends and historical data and look at what is currently happening to predict what 'may' happen in the future.

I've always said to my clients that I can only accurately predict about 2 to 4 weeks into the future.  That's it, much longer than that time period is more of a best guess.

Volume of sales has continued to be typical and strong, no major drop or trend downward for number of sales - more typcial for this time of year.

Our market average prices have softened since about Labour Day this year and condos seem to be the hardest hit. Prices are still dropping in the market and especially the condo market, not dramatically, but they are dropping.

This is in contrast to the unprecedented growth we have experienced for more than 15 years. The only interruption to that rise in prices was in the fall of 2008

You can clearly see the seasonal trends of prices increasing in the spring and fall at this graph See the Average Price Cycles from January 1995 to Date

The average price fluctuations are shown at this average price graph over the past few months.
Near historic lows for mortgage interest rates have helped.

I don't believe we were in a bubble but our prices were certainly over inflated. The rental market is still very tight. This is good news and indicates that people are working and that there is still a strong need for rental housing. If the rental market softens then our resale market will get hit much harder than it is right now. There are no signs of this happening in the near future and let's hope that our market turns around in the early part of 2013. Only time will tell.

Conclusion: our real estate market will continue to be healthy, prices will continue to drop in the near term, at least until the middle of January.  Check back in mid January to see what our market is doing at that time!
Thank you to all my current and past clients I wish you a Merry Christmas and All the Best to you and your family in 2013!

Mark


For more information please contact A. Mark Argentino

A. Mark Argentino, Broker, P.Eng.,
Specializing in Residential & Investment Real Estate
RE/MAX Realty Specialists Inc., Brokerage
2691 Credit Valley Road, Suite 101, Mississauga, Ontario L5M 7A1
BUS. 905-828-3434
FAX. 905-828-2829
E-MAIL: mark@mississauga4sale.com
Website: Mississauga4Sale.com
Toronto Real Estate Board (TREB) Average Prices and Graph

Wednesday, December 19, 2012

Average prices for condominium units based upon the number of bedrooms in the Mississauga City Centre breakdown for the 3rd Quarter of 2012


This chart below shows the average prices for condominium units based upon the number of bedrooms in the Mississauga City Centre breakdown for the 3rd Quarter of 2012


For more information please contact A. Mark Argentino

A. Mark Argentino, Broker, P.Eng.,
Specializing in Residential & Investment Real Estate
RE/MAX Realty Specialists Inc., Brokerage
2691 Credit Valley Road, Suite 101, Mississauga, Ontario L5M 7A1
Toronto Real Estate Board (TREB) Average Prices and GraphBUS. 905-828-3434
FAX. 905-828-2829
E-MAIL: mark@mississauga4sale.com
Website: Mississauga4Sale.com

Thursday, December 06, 2012

Mississauga and GTA real estate market results for last month are now in the books!

TREB reports that the sales volume of homes is down but prices are up year over year.  In fact prices are down from the previous month about 4% and this is a trend we have seen recently.

It could be the time of year or a trend, nobody can know for sure.  We will need to wait a few more months to determine if it's a longer term trend.

See the full report from TREB below.
Mark

See graphs at this link

Sales Dip in November while Selling Prices Increase


TORONTO, December 5, 2012 – Greater Toronto Area REALTORS® reported 5,793 sales in
November 2012 – down by 16 per cent compared to November 2011.

“Transactions have been down on a year-over-year basis since June, after being up substantially in the last half of 2011 and the first half of 2012. Some buyers pulled forward their decision to purchase, which has impacted sales levels in the second half of 2012,” said Toronto Real Estate Board (TREB) President Ann Hannah.


“Stricter mortgage lending guidelines, including a reduced maximum amortization period and a purchase price ceiling of one-million dollars for government insured mortgages, have prompted some buyers to move to the sidelines. This situation has been exacerbated in the City of Toronto because the additional upfront Land Transfer Tax takes money away from buyers that otherwise could be used for a larger down payment,” continued Hannah.

The average selling price was up by 1.6 per cent annually to $485,328. The MLS® Home Price Index (MLS® HPI) Composite Benchmark was up by 4.6 per cent compared to last year.

“The moderate annual rate of price growth compared to previous months was largely due to a different mix in detached home sales this year compared to last, particularly in the City of Toronto. The share of detached homes that sold for over one-million dollars was down substantially, which influenced the overall average price,” said Jason Mercer, TREB’s Senior Manager of Market Analysis.

“The MLS® HPI detached benchmark price, which tracks the price for a home with the same attributes over time, was up by almost six per cent in Toronto, suggesting that market conditions for low-rise homes remain quite tight despite a changing mix of sales,” added Mercer
For more information please contact A. Mark Argentino

A. Mark Argentino, Broker, P.Eng.,
Specializing in Residential & Investment Real Estate
RE/MAX Realty Specialists Inc., Brokerage
2691 Credit Valley Road, Suite 101, Mississauga, Ontario L5M 7A1
BUS. 905-828-3434
FAX. 905-828-2829
E-MAIL: mark@mississauga4sale.com
Website: Mississauga4Sale.com

UPDATE

see the average price and sales volumes each year since 2001 to 2011 in the table below
historical annual price and sales volumes since 2001 to 2011

Monday, November 19, 2012

Mississauga real estate and GTA mid month real estate sales figures

Bottom line is that the number of transactions were down about 17% for the
first two weeks of November.

See the full report below.


GTA REALTORS(r) RELEASE MID-MONTH RESALE FIGURES

TORONTO, November 19, 2012 - Greater Toronto Area REALTORS(r) reported 2,687
transactions through the TorontoMLS system during the first two weeks of
November.

This result represented a 17.5 per cent decline compared to the same period
in 2011.

"The reduction of the maximum amortization period to 25 years translated
into higher mortgage payments. Some households will have to save more money
for a down payment before purchasing a home, in order to offset these higher
mortgage costs.

This is more difficult in the City of Toronto, where households must pay an
additional land transfer tax up front. The abolishment of this tax would
allow buyers to have a larger down payment," said Toronto Real Estate Board
(TREB) President Ann Hannah.

The average selling price during the first 14 days of November was $488,647
- up by 1.7 per cent in comparison to the first 14 days of November 2011.
The median selling price over the same period was up by a greater rate of
four per cent to $416,000. The stronger rate of growth for the median
selling price suggests that fewer high-end homes sold this year compared to
last.

"During the first half of November, there were fewer luxury detached homes
sold as a percentage of total transactions compared to last year. The
year-over-year change in the mix of detached homes sold in the GTA, rather
than a change in market conditions, was responsible for a lower than normal
increase in the average detached home price," said Jason Mercer, TREB's
Senior Manager of Market Analysis.


I hope this finds you Happy and Healthy!

All the Best!

Mark

A. Mark Argentino
P. Eng. Broker
Specializing in Residential & Investment Real Estate
RE/MAX Realty Specialists Inc.
Providing Full-Time Professional Real Estate Services since 1987
BUS 905-828-3434
FAX 905-828-2829 CELL 416-520-1577
mark@mississauga4sale.com
Mississauga4Sale.com

* Thinking of selling your home in the next 3 to 6 months? Would you
like a Complimentary & Quick Over-The-Net Home Evaluation ?
www.mississauga4sale.com/internet-evaluation.htm


* Power of Sales and Foreclosures
www.mississauga4sale.com/Power-Sales-Bank-Sales-Alert-Request.htm


* If you have not already signed up to receive my monthly real estate
newsletter, you may do so here: On-Line Real Estate Newsletter sign up
www.mississauga4sale.com/popupquestion.htm


* See seasonal housing patterns
www.mississauga4sale.com/TREBprice.htm


* Would you like me to send you a desk or wall Calendar?
www.mississauga4sale.com/Calendar-Order-Form.htm

Monday, November 05, 2012

GTA Real Estate Sales volumes down between 7 and 15% for monthly figures for November 2012


This is the latest report from the Toronto Real Estate Board on monthly sales figures from November.

I'll publish the complete report shortly and provide a link for you.

Mark

GTA REALTORS® RELEASE MONTHLY RESALE HOUSING FIGURES

TORONTO, November 3, 2012 – Greater Toronto Area REALTORS® reported 6,896 transactions through the TorontoMLS system in October 2012 – a decrease of 7.1 per cent compared to October 2011. There were two more business days in October 2012 versus October 2011. On a per business day basis, transactions were down by 15.6 per cent.*

“Sales have decreased in the second half of this year compared to 2011, especially since the onset of stricter mortgage lending guidelines at the beginning of July. The prospect of higher monthly mortgage payments due to the reduced maximum amortization period has prompted some households to delay their home purchase,” said Toronto Real Estate Board (TREB) President Ann Hannah.

The average selling price for October transactions was $503,479 – up 6.2 per cent compared to October 2011. The MLS® Home Price Index composite benchmark price, which allows for an apples-to-apples comparison in terms of home attributes, was up by 5.1 per cent.

“We continue to see price increases well above the rate of inflation. Active listings have remained low from a historic perspective, so substantial competition between buyers still exists, especially for low-rise homes,” said Jason Mercer, TREB’s Senior Manager of Market Analysis.

“It should be noted, however, that the annual rate of price increase has been edging lower over the past few months as the market has gradually become better supplied,” continued Mercer.


For more information please contact A. Mark Argentino

A. Mark Argentino, Broker, P.Eng.,
Specializing in Residential & Investment Real Estate
RE/MAX Realty Specialists Inc., Brokerage
2691 Credit Valley Road, Suite 101, Mississauga, Ontario L5M 7A1
BUS. 905-828-3434
FAX. 905-828-2829
E-MAIL: mark@mississauga4sale.com
Website: Mississauga4Sale.com

Thursday, October 04, 2012

GTA REALTORSR RELEASE MONTHLY RESALE HOUSING FIGURES

this is the latest report from TREB on the sales and average prices for
September


GTA REALTORS(r) RELEASE MONTHLY RESALE HOUSING FIGURES

TORONTO, October 3, 2012 - Greater Toronto Area (GTA) REALTORS(r) reported
5,879 transactions through the TorontoMLS system in September 2012. The
average selling price for these transactions was $503,662, representing an
increase of more than 8.5 per cent compared to last year.

The number of transactions was down by 21 per cent in comparison to
September 2011. However, it is important to note that there were two fewer
working days in September 2012 compared to September 2011. The majority of
transactions are entered on working days. On a per working day basis, sales
were down by 12.5 per cent year-over-year.

"While sales have been lower due to stricter mortgage lending guidelines, we
continue to see substantial competition between buyers. The months of
inventory trend remains low from a historic perspective, which explains the
strong price increases we are experiencing," said Toronto Real Estate Board
President Ann Hannah.

September average selling prices were up compared to last year for all major
home types. Price growth was strongest in the City of Toronto, including
condominium apartments with eight per cent year-over-year growth. All
benchmark home types included in the MLS(r) Home Price Index (MLS(r) HPI)
experienced year-over-year price increases, with substantially stronger
increases for low-rise home types.

"Barring a major change to the consensus economic outlook, home price growth
is expected to continue through 2013. Based on inventory levels, price
growth will be strongest for low-rise home types, including single-detached
and semi-detached houses and town homes," said TREB's Senior Manager of
Market Analysis, Jason Mercer.

Mark

Saturday, September 08, 2012

September 2012 latest figures from the Toronto Real Estate Board

These are the latest figures from the Toronto Real Estate Board

http://www.mississauga4sale.com/TREBprice.htm


GTA REALTORS(r) RELEASE MONTHLY RESALE MARKET FIGURES

TORONTO, September 6, 2012 - Greater Toronto Area (GTA) REALTORS(r) reported
6,418 sales through the TorontoMLS system in August 2012, representing a
year-over-decline of almost 12.5 per cent compared to 7,330 sales reported
in August 2011. The number of new listings reported in August was down by
5.5 per cent compared to the same period in 2011.

"Residential transactions were down in August compared to last year.
Stricter mortgage lending guidelines, which came into effect in July,
arguably played a role. In the City of Toronto, the additional impact of
relatively higher home prices coupled with the upfront cost associated with
the City's Land Transfer Tax led to a stronger annual decline in sales
compared to the rest of the GTA," said Toronto Real Estate Board (TREB)
President Ann Hannah.

The average selling price for August 2012 transactions was $479,095 - up by
almost 6.5 per cent compared to August 2011. The annual rate of price growth
was driven by the low-rise home segment in the City of Toronto, including
single-detached homes with an average annual price increase of 15 per cent.
The MLS(r) Home Price Index (MLS(r) HPI)* composite index, which allows for
an apples-to-apples comparison of benchmark home prices from one year to the
next, was up by 6.3 per cent year-over-year.

"While sales were down year-over-year in the GTA, so too were new listings.
As a result, market conditions remained quite tight with substantial
competition between buyers in the low-rise market segment," said Jason
Mercer, TREB's Senior Manager of Market Analysis. "The trends for sales and
new listings are moving somewhat in synch, suggesting that the relationship
between sales and listings will continue to promote price growth moving
forward."

I hope this finds you Happy and Healthy!

All the Best!

Mark

A. Mark Argentino
P. Eng. Broker
Specializing in Residential & Investment Real Estate
RE/MAX Realty Specialists Inc.
Providing Full-Time Professional Real Estate Services since 1987
BUS 905-828-3434
FAX 905-828-2829 CELL 416-520-1577
mark@mississauga4sale.com
Mississauga4Sale.com

* Thinking of selling your home in the next 3 to 6 months? Would you
like a Complimentary & Quick Over-The-Net Home Evaluation ?
www.mississauga4sale.com/internet-evaluation.htm


* Power of Sales and Foreclosures
www.mississauga4sale.com/Power-Sales-Bank-Sales-Alert-Request.htm


* If you have not already signed up to receive my monthly real estate
newsletter, you may do so here: On-Line Real Estate Newsletter sign up
www.mississauga4sale.com/popupquestion.htm


* See seasonal housing patterns
www.mississauga4sale.com/TREBprice.htm


* Would you like me to send you a desk or wall Calendar?
www.mississauga4sale.com/Calendar-Order-Form.htm

Friday, April 06, 2012

Latest Toronto GTA real estate marketplace from the Toronto Real Estate Board April 2012

This is a summary of the latest GTA real estate marketplace from the Toronto Real Estate Board

Average price in March as $504,117 up 10% compared to March 2011 and volume of sale are up about 8%


See the graphs at my site


Read the full report below.

GTA REALTORS(r) Report Monthly Resale Housing Market Figures

Toronto, April 4, 2012 - Greater Toronto REALTORS(r) reported 9,690 sales through the TorontoMLS System in March 2012. This result was up by almost eight per cent in comparison to the 8,986 deals reported during the same period in 2011.

"The GTA resale market has not suffered from a lack of willing buyers this year. Buyers have been spurred on by the positive affordability picture brought about by low mortgage rates," said Toronto Real Estate Board President Richard Silver. "The challenge has been a lack of inventory. Many listings have attracted multiple interested buyers. Strong competition has led to annual rates of price growth well above the long-term average."

The average selling price in the GTA was $504,117 in March - up by 10.5 per cent in comparison to March 2011.

"The number of new listings was up last month in comparison to March 2011.


However, based on the historic relationship between price and listings, the GTA resale market should be better supplied. If competition between buyers remains as strong as it is right now, we will almost certainly see an average selling price above $500,000 for 2012 as a whole," said Jason Mercer, TREB's Senior Manager of Market Analysis.


I hope this finds you Happy and Healthy!

All the Best!

Mark

A. Mark Argentino
P. Eng. Broker
Specializing in Residential & Investment Real Estate
RE/MAX Realty Specialists Inc.
Providing Full-Time Professional Real Estate Services since 1987
BUS 905-828-3434
FAX 905-828-2829 CELL 416-520-1577
mark@mississauga4sale.com
Mississauga4Sale.com

* Thinking of selling your home in the next 3 to 6 months? Would you
like a Complimentary & Quick Over-The-Net Home Evaluation ?
www.mississauga4sale.com/internet-evaluation.htm


* Power of Sales and Foreclosures
www.mississauga4sale.com/Power-Sales-Bank-Sales-Alert-Request.htm


* If you have not already signed up to receive my monthly real estate
newsletter, you may do so here: On-Line Real Estate Newsletter sign up
www.mississauga4sale.com/popupquestion.htm


* See seasonal housing patterns
www.mississauga4sale.com/TREBprice.htm


* Would you like me to send you a desk or wall Calendar?
www.mississauga4sale.com/Calendar-Order-Form.htm

Tuesday, March 06, 2012

GTA real estate market has tight market that pushes the average price above $500K in Toronto

This is the latest from the Toronto Real Estate Board


Tight Market Pushes the Average Price above $500K TORONTO

March 5, 2012

Greater Toronto REALTORS(r) reported 7,032 sales in February 2012 - up 16 per cent compared to February 2011.

New listings were also up over the same period, but by a lesser 11 per cent to 12,684. It is important to note that 2012 is a leap year, with one more day in February.

Over the first 28 days of February, sales and new listings were up by ten per cent and six per cent respectively. "With slightly more than two months of inventory in the Toronto Real Estate Board (TREB) market area, on average, it is not surprising that competition between buyers has exerted very strong upward pressure on the average selling price.

Price growth will continue to be very strong until the market becomes better supplied," said Toronto Real Estate Board President Richard Silver. "It is
important to note that both buyers and sellers are aware of current market conditions.

This is evidenced by the fact that homes sold, on average, for 99 per cent of the asking price in February," continued Silver.

The average selling price in the TREB market area was $502,508 in February - up 11 per cent compared to February 2011.

The Composite MLS(r) Home Price Index for TREB, which provides a less volatile measure of price growth compared to the average price, was up by 7.3 per cent compared February 2011.

"If tight market conditions continue to result in higher than expected price growth as we move into the spring, expectations for 2012 as a whole will have to be revised upwards," said Jason Mercer, TREB's Senior Manager of Market Analysis.

"While price growth remains strong, the average selling price remains affordable from a mortgage lending perspective for a household earning the average income in the GTA."

Read more and see graphs of prices at this page

I hope this finds you Happy and Healthy!

All the Best!

Mark

I hope this finds you Happy and Healthy!

All the Best!

Mark

A. Mark Argentino
P. Eng. Broker
Specializing in Residential & Investment Real Estate
RE/MAX Realty Specialists Inc.
Providing Full-Time Professional Real Estate Services since 1987
BUS 905-828-3434
FAX 905-828-2829 CELL 416-520-1577
mark@mississauga4sale.com
Mississauga4Sale.com

* Thinking of selling your home in the next 3 to 6 months? Would you
like a Complimentary & Quick Over-The-Net Home Evaluation ?
www.mississauga4sale.com/internet-evaluation.htm


* Power of Sales and Foreclosures
www.mississauga4sale.com/Power-Sales-Bank-Sales-Alert-Request.htm


* If you have not already signed up to receive my monthly real estate
newsletter, you may do so here: On-Line Real Estate Newsletter sign up
www.mississauga4sale.com/popupquestion.htm


* See seasonal housing patterns
www.mississauga4sale.com/TREBprice.htm


* Would you like me to send you a desk or wall Calendar?
www.mississauga4sale.com/Calendar-Order-Form.htm

Friday, February 24, 2012

2012 TREB Affordability Indicator Share of Average Household Income Used for Mortgage Principal and Interest, Property Taxes and Utilities

This chart plots the share of average household income that goes toward mortgage principal and interest, property taxes and utilities for the average priced home in the GTA subject to the following assumptions:
1.Average annual or year-to-date home price as reported by TREB
2.20 per cent down payment
3.Average 5-year fixed mortgage rate (Statistics Canada); 25-year amortization
4.Average property tax rate reported by/estimated from the Statistics Canada Survey of Household Spending
5.Average utilities cost reported by/estimated from the Statistics Canada Survey of Household Spending and components of the Consumer Price Index
6.Average household income reported by the Census of Canada.


Toronto Real Estate Board (TREB) Average Prices and Graph

For more information please contact A. Mark Argentino

A. Mark Argentino, Broker, P.Eng.,
Specializing in Residential & Investment Real Estate
RE/MAX Realty Specialists Inc., Brokerage
2691 Credit Valley Road, Suite 101, Mississauga, Ontario L5M 7A1
BUS. 905-828-3434
FAX. 905-828-2829
E-MAIL: mark@mississauga4sale.com
Website: Mississauga4Sale.com

Thursday, February 23, 2012

2012 TREB MLS® Sales-to-New Listings Ratio Compared to Average Annual Per Cent Change in Home Price

This chart plots the monthly sales-to-new listings ratio (blue line) with year-over-year average annual per cent price change (brown line). When the sales-to-new listings ratio moves higher, average annual per cent change in home prices generally trends higher. When the sales-to-new listings ratio moves lower, average annual per cent change in home prices generally trends lower.


Toronto Real Estate Board (TREB) Average Prices and Graph

For more information please contact A. Mark Argentino

A. Mark Argentino, Broker, P.Eng.,
Specializing in Residential & Investment Real Estate
RE/MAX Realty Specialists Inc., Brokerage
2691 Credit Valley Road, Suite 101, Mississauga, Ontario L5M 7A1
BUS. 905-828-3434
FAX. 905-828-2829
E-MAIL: mark@mississauga4sale.com
Website: Mississauga4Sale.com

Tuesday, February 21, 2012

2012 TREB MLS® Average Price Monthly Time Series with Trend Line Actual

This chart plots monthly MLS® average price since January 1995. The blue line shows the actual average price. The brown line is the trend computed using a 12-month moving average, which exhibits no seasonal variations or other irregular fluctuations. A substantial change in actual average price must occur to change the direction of the trend.


Toronto Real Estate Board (TREB) Average Prices and Graph

For more information please contact A. Mark Argentino

A. Mark Argentino, Broker, P.Eng.,
Specializing in Residential & Investment Real Estate
RE/MAX Realty Specialists Inc., Brokerage
2691 Credit Valley Road, Suite 101, Mississauga, Ontario L5M 7A1
BUS. 905-828-3434
FAX. 905-828-2829
E-MAIL: mark@mississauga4sale.com
Website: Mississauga4Sale.com

Monday, February 20, 2012

2012 TREB MLS® New Listings Monthly Time Series with Trend Line

This chart plots monthly MLS® new listings since January 1995. The blue line shows actual new listings. The brown line is the trend computed using a 12-month moving average, which exhibits no seasonal variations or other irregular fluctuations. A substantial change in actual new listings must occur to change the direction of the trend.


Toronto Real Estate Board (TREB) Average Prices and Graph

For more information please contact A. Mark Argentino

A. Mark Argentino, Broker, P.Eng.,
Specializing in Residential & Investment Real Estate
RE/MAX Realty Specialists Inc., Brokerage
2691 Credit Valley Road, Suite 101, Mississauga, Ontario L5M 7A1
BUS. 905-828-3434
FAX. 905-828-2829
E-MAIL: mark@mississauga4sale.com
Website: Mississauga4Sale.com

Friday, February 17, 2012

2012 TREB MLS® Sales Monthly Time Series with Trend Line

This chart plots monthly MLS® sales since January 1995. The blue line shows actual sales. The brown line is the trend computed using a 12-month moving average, which exhibits no seasonal variations or other irregular fluctuations. A substantial change in actual sales must occur to change the direction of the trend.


Toronto Real Estate Board (TREB) Average Prices and Graph

For more information please contact A. Mark Argentino

A. Mark Argentino, Broker, P.Eng.,
Specializing in Residential & Investment Real Estate
RE/MAX Realty Specialists Inc., Brokerage
2691 Credit Valley Road, Suite 101, Mississauga, Ontario L5M 7A1
BUS. 905-828-3434
FAX. 905-828-2829
E-MAIL: mark@mississauga4sale.com
Website: Mississauga4Sale.com

Thursday, February 16, 2012

Sales for the first half of February up by more than 9% compared to the same period last year Toronto Real Estate Board


Below is the latest report from the Toronto Real Estate Board regarding the sales for the first half of February, up by more than 9% compared to the same period last year.


GTA REALTORS(r) Report Mid-Month Resale Housing Market Figures


Toronto, February 16, 2012 - Greater Toronto REALTORS(r) reported 3,206 sales through the TorontoMLS(r) system through the first 14 days of February 2012 - up by more than nine per cent compared to the 2,933 sales reported during the same period in 2011. New listings were up by 13 per cent over the same period.


"The GTA resale home market became better supplied during the first 14 days of February. If growth in new listings continues to outstrip growth in sales this year, competition between home buyers will ease. More balanced market conditions on a sustained basis would result in a lower annual rates of price growth later in 2012," said Toronto Real Estate Board (TREB) President
Richard Silver.


The average selling price during the first 14 days of February was $491,493 - up by nine per cent compared to the first 14 days of February 2011. On average, sellers received 99 per cent of their asking price and their homes were on the market for an average of 25 days.


"Both buyers and sellers are aware of the substantial competition that exists for most listings in the GTA. There is not a mismatch in expectations, so homes sell quickly at close to the asking price," said Jason Mercer, TREB's Senior Manager of Market Analysis.


I hope this finds you Happy and Healthy!


All the Best!


Mark


A. Mark Argentino
P. Eng. Broker
Specializing in Residential & Investment Real Estate
RE/MAX Realty Specialists Inc.
Providing Full-Time Professional Real Estate Services since 1987
BUS 905-828-3434
FAX 905-828-2829 CELL 416-520-1577
mark@mississauga4sale.com
Mississauga4Sale.com


* Thinking of selling your home in the next 3 to 6 months? Would you
like a Complimentary & Quick Over-The-Net Home Evaluation ?
www.mississauga4sale.com/internet-evaluation.htm


* Power of Sales and Foreclosures
www.mississauga4sale.com/Power-Sales-Bank-Sales-Alert-Request.htm


* If you have not already signed up to receive my monthly real estate
newsletter, you may do so here: On-Line Real Estate Newsletter sign up
www.mississauga4sale.com/popupquestion.htm


* See seasonal housing patterns
www.mississauga4sale.com/TREBprice.htm


* Would you like me to send you a desk or wall Calendar?
www.mississauga4sale.com/Calendar-Order-Form.htm

2012 TREB MLS® Average Resale Home Price Monthly with Three Previous Years for Comparison


Toronto Real Estate Board (TREB) Average Prices and Graph
Explanation: This chart plots the monthly MLS® average home price for the current year and the previous three years. The recurring seasonal trend can be examined along with comparisons to previous years for each month.


For more information please contact A. Mark Argentino

A. Mark Argentino, Broker, P.Eng.,
Specializing in Residential & Investment Real Estate
RE/MAX Realty Specialists Inc., Brokerage
2691 Credit Valley Road, Suite 101, Mississauga, Ontario L5M 7A1
BUS. 905-828-3434
FAX. 905-828-2829
E-MAIL: mark@mississauga4sale.com
Website: Mississauga4Sale.com

Tuesday, February 14, 2012

2012 TREB MLS® Sales-to-New Listings Ratio Monthly with Three Previous Years for Comparison


Toronto Real Estate Board (TREB) Average Prices and Graph


Explanation: This chart plots the monthly MLS® sales-to-new listings ratio (SNLR) for the current year and the previous three years. The recurring seasonal trend can be examined along with comparisons to previous years for each month. When the SNLR moves higher, annual average price growth generally increases – often at a rate well above inflation. When the SNLR moves lower, annual average price growth generally declines and can become negative.


For more information please contact A. Mark Argentino

A. Mark Argentino, Broker, P.Eng.,
Specializing in Residential & Investment Real Estate
RE/MAX Realty Specialists Inc., Brokerage
2691 Credit Valley Road, Suite 101, Mississauga, Ontario L5M 7A1
BUS. 905-828-3434
FAX. 905-828-2829
E-MAIL: mark@mississauga4sale.com
Website: Mississauga4Sale.com

Monday, February 13, 2012

2012 TREB MLS® New Listings Monthly with Three Previous Years for Comparison


Toronto Real Estate Board (TREB) Average Prices and Graph


Explanation: This chart plots monthly MLS® new listings for the current year and the previous three years. The recurring seasonal trend can be examined along with comparisons to previous years for each month.


For more information please contact A. Mark Argentino

A. Mark Argentino, Broker, P.Eng.,
Specializing in Residential & Investment Real Estate
RE/MAX Realty Specialists Inc., Brokerage
2691 Credit Valley Road, Suite 101, Mississauga, Ontario L5M 7A1
BUS. 905-828-3434
FAX. 905-828-2829
E-MAIL: mark@mississauga4sale.com
Website: Mississauga4Sale.com

Friday, February 10, 2012

2012 TREB MLS® Sales Monthly with Three Previous Years for Comparison


Toronto Real Estate Board (TREB) Average Prices and Graph
Explanation: This chart plots monthly MLS® sales for the current year and the previous three years. The recurring seasonal trend can be examined along with comparisons to previous years for each month

For more information please contact A. Mark Argentino

A. Mark Argentino, Broker, P.Eng.,
Specializing in Residential & Investment Real Estate
RE/MAX Realty Specialists Inc., Brokerage
2691 Credit Valley Road, Suite 101, Mississauga, Ontario L5M 7A1
BUS. 905-828-3434
FAX. 905-828-2829
E-MAIL: mark@mississauga4sale.com
Website: Mississauga4Sale.com

Thursday, February 09, 2012

Canada's Housing Market in 2012 - bubble or balloon?

A client of mine just sent me this Great article below about Canada's Housing Market


I've been worried about a bubble or a balloon in our local market since about 2003 when many of us thought "prices can't go higher" and sure enough they just kept marching upward.

Since I've been plugged into the real estate market and prices since the early 80's it's difficult for me to comprehend after a rise each year since 1995 of 6 to 10% that prices can continue to escalate. It is the opposite of the old school thinking of 7 year economic cycles that we used to experience and intuitively, we all know that prices cannot continue to rise indefinitely.

So where is the peak? Nobody knows for sure, but I don't think we are there yet in the GTA

It's a little disconcerting to see prices so high. If interest rates begin to increase, as they are suggesting by the beginning of 2013 then it could start a slowdown.

In Toronto we lack listings. There has been a low amount of listings since January of 2009 and the demand just keeps on increasing, hence the multiple offers on properties that are priced well.

We are looking to purchase a bungalow in an average area of Oakville, one was listed on Monday this week for $579,900 and it sold firm by Wednesday for $620,000 I heard there were 11 offers, silly!

Any worry is as the article below states "Vancouver's ratio of home prices to incomes is the highest in the English-speaking world" and that is some cause for concern.

I was surprised to read that Toronto is building more than 75 skyscrapers compared to New York, they just don't seem to be able to build condos fast enough in Toronto for the past decade or so.

Time will tell what happens with the market. Personally, I don't see interest rates rising much more than .5% by the end of 2013 and I don't see a plethora of listings coming on the market either for the next 3 to 6 months, this only means that demand will eat up any new supply and prices will likely continue to increase for at least the next 3 to 6 months in the GTA.

All the best!
Mark


Canada's Housing Market


Look out below


After years of lecturing America about loose lending, Canada now must
confront a bubble of its own


Feb 4th 2012 TORONTO from the print edition


*


IN FEW corners of the world would a car park squeezed between two arms of an
elevated highway be seen as prime real estate. In Toronto, however, a
75-storey condominium is planned for such an awkward site, near the
waterfront. The car park next door will become a pair of 70-storey towers
too. In total, 173 sky-scrapers are being built in Toronto, the most in
North America. New York is second with 96.


When the United States saw a vast housing bubble inflate and burst during
the 2000s, many Canadians felt smug about the purported prudence of their
financial and property markets. During the crash, Canadian house prices fell
by just 8%, compared with more than 30% in America. They hit new record
highs by 2010. "Canada was not a part of the problem," Stephen Harper, the
prime minister, boasted in 2010.


Today the consensus is growing on Bay Street, Toronto's answer to Wall
Street, that Mr Harper may have to eat his words. In response to America's
slow economic recovery and uncertainty in Europe, the Bank of Canada has
kept interest rates at record lows. Five-year fixed-rate mortgages now
charge interest of just 2.99%. In response, Canadians have sought
ever-bigger loans for ever-costlier homes. The country's house prices have
doubled since 2002.


Speculators are pouring into the property markets in Toronto and Vancouver.
"We have foreign investors who are purchasing two, three, four, five
properties," says Michael Thompson, who heads Toronto's economic-development
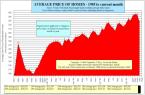
committee. Last month a modest Toronto home put on the market for C$380,000
($381,500) sold for C$570,000, following a bidding war among 31 prospective
buyers. According to Demographia, a consultancy, Vancouver's ratio of home
prices to incomes is the highest in the English-speaking world.


Bankers are becoming alarmed. Mark Carney, the governor of the central bank,
has been warning for years that Canadians are consuming beyond their means.
The bosses of banks with big mortgage businesses, including CIBC, Royal Bank
of Canada and the Bank of Montreal, have all said the housing market is at
or near its peak. Canada's ratio of household debt to disposable income has
risen by 40% in the past decade, recently surpassing America's (see chart).
And its ratio of house prices to income is now 30% above its historical
average-less than, say, Ireland's excesses (which reached 70%), but high
enough to expect a drop. A recent report from Bank of America said Canada
was "showing many of the signs of a classic bubble".


The consequences of such a bubble bursting are hard to predict. On the one
hand, high demand for Canada's commodity exports could cushion the blow from
a housing bust. And since banks have recourse to all of a borrower's assets,
and Canadian lending standards are stricter than America's were, a decline
in house prices would probably not wreck the banks as it did in the United
States.


However, the Canadian economy is still dependent on the consumer. Fears
about the global economy have slowed business investment, and all levels of
government are bent on austerity. The Conservative government's next budget
is expected to put forward a plan to close the federal deficit, now 2% of
GDP, by 2015-modest austerity compared to Europe's, but still a drag on the
economy. Few new jobs are being created. Assuming there is no setback in
Europe's debt crunch, slowdown in America or drop in commodity prices, GDP
is forecast to grow by a meagre 2% this year. If consumers start feeling
less well off, Canada could slip back into recession.


The inevitable landing will probably be soft. Increases in house prices and
sales volumes are slowing, and the 2015 Pan American Games in Toronto should
prop up builders. "The national housing market is more like a balloon than a
bubble," says a report by the Bank of Montreal. "While bubbles always burst,
a balloon often deflates slowly in the absence of a 'pin'."


Moreover, the government is trying to cool the market. The banking regulator
is increasing its scrutiny of housing in response to concerns about
speculators. The Canada Mortgage and Housing Corporation, a government
mortgage-insurance agency, says it will have to start reducing its new
coverage because of legal limits. And the finance ministry has cut the
maximum term of publicly insured mortgages from 35 years to 30. Some bank
managers are calling for it to be reduced to 25, the historical norm.
Canada's reputation for financial sobriety is not entirely unwarranted.


However, the state has refused to use its most powerful tool. To protect
business investment, the central bank has made clear that it plans to keep
interest rates low. As long as money stays cheap, the balloon could get
bigger-perhaps big enough to become a fully fledged bubble after all.


from the print edition The Americas