Showing posts with label TREB-real-estate. Show all posts

Friday, February 24, 2023

Bank of Canada current interest rate


In January 2023 the Bank of Canada raised it's benchmark interest rate again, this time to 4.50%

Bank of Canada raises borrowing costs for seventh time in a row amid stubbornly high inflation. The Central bank has been raising rates aggressively to rein in sky-high inflation.

Since March of 2022, the central bank has raised its key interest rate six consecutive times, bringing it from 0.25 per cent to 4.50 per cent.

The Bank of Canada hiked its trendsetting interest rate by 1/2 percentage point on Wednesday.

The current rate is 4.50%

The Bank Prime rate for most lenders now stands at 6.70%
Toronto Real Estate Board (TREB) Average Prices and Graph

For more information please contact A. Mark Argentino

A. Mark Argentino, Broker, P.Eng.,
Specializing in Residential & Investment Real Estate
RE/MAX Realty Specialists Inc., Brokerage
2691 Credit Valley Road, Suite 101, Mississauga, Ontario L5M 7A1
BUS. 905-828-3434
FAX. 905-828-2829
E-MAIL: mark@mississauga4sale.com
Website: Mississauga4Sale.com

Monday, November 05, 2018

Real Estate Prices UP and Sales Volume UP - Mississauga and GTA Real Estate Newsletter November 2018 - Issue 11:05

Real Estate Prices UP and Sales Volume UP - Mississauga and GTA Real Estate Newsletter November 2018 - Issue 11:05

Once again, last month was another very strong month for sales and prices in the GTA.

November 2018 News
Greetings from Fabulous Mississauga!
  • The average selling price last month was $807,340 (it was $796,786the previous month) and it was up about 3.5% compared to previous same month last year - see graph of prices here
  • Greater Toronto Area REALTORS® reported 7,492 (it was 6,455 last month) residential sales through TREB’s MLS® System last month. This result represented a 6% increase compared to sales reported in the same month in 2017.
  • The MLS® Home Price Index (HPI) Composite Benchmark price was up 2.6% on a year-over-year basis. 

  • The Bank Prime rate for most lenders now stands at3.95% read more about Interest rates
  • The Bank of Canada Prime Lending Rate is the same as last month at1.75% read more


Toronto Real Estate Board (TREB) Average Prices and Graph

For more information please contact A. Mark Argentino

A. Mark Argentino, Broker, P.Eng.,
Specializing in Residential & Investment Real Estate
RE/MAX Realty Specialists Inc., Brokerage
2691 Credit Valley Road, Suite 101, Mississauga, Ontario L5M 7A1
BUS. 905-828-3434
FAX. 905-828-2829
E-MAIL: mark@mississauga4sale.com
Website: Mississauga4Sale.com

Friday, August 25, 2017

Sales Bubble? Average GTA Prices and Sales volumes can seem confusing - I'll try and remove some of the confusion

I just received a question from a reader and thought I would share the question and my answer to you.

The question was:

Hello Mark,

I  was able to observe  some variances the monthly price statics in your website and other data sources as noted below.  Since you're a professional Engineer I am confident that you have much stronger quantitative skills than most realtors and was wondering if you could help me to reconcile some real estate pricing data? 

I am specifically referring to the the Oakville Milton and York Region pricing data.   


Regards,

G.

Hello G

Thank you for your email.

The Huffington Post article you are referring to below flips back and forth talking about volume of sales and sales prices.  Then at the end of the article they quote that prices are still up comparing July 2016 to July 2017 by 5.1%   I can see how this can seem confusing.

The chart they show are actual selling prices in the two areas, York and Oakville Milton.  The article states that the graphs are 'Residential Sales" and I'm assuming they are showing "only" detached home prices, not the overall average residential (which would include condos townhomes etc. I say this because I don't believe the average of ALL residential in Oakville and Milton in the spring was ever about $2.3Million.    Seems high for the 'average'  Regardless, I would say that the graphs are likely very accurate. 

You could write the author and ask where the data came from and what the actual data is showing.

You can see my graph of the data here:


It is similar to the data shown in the article.

My graph also shows a drop in the overall TREB average single family residential price from approximately $916k in March 2017 to $746k in July 2017 – a giant overall drop in average price.  This coincides with the seasonal summer slowdown period, so it's not quite as dramatic as you many think.  On the other hand, it's only the second time since January of 1995 that summer prices have dropped below the previous fall average prices – this signals a significant change in the marketplace.

It's not all doom and gloom, but it shows how quickly the market can turn.  We've seen this before in 1988/1989 and again in 2008/2009 - this could be a short blip in the market or a trend, only time will tell!

I hope this helps a little.

Please let me know if you have other questions

Thank you,
Mark

Monday, June 05, 2017

Mississauga and GTA Real Estate Marketplace Conditions as reported on June 5th 2017

Hello from Fabulous Mississauga!

The latest numbers have just been reported from TREB for last months (May 2017) real estate marketplace.

As expected, the number of MLS listings are up by over 42% and the number of sales were down by 26%

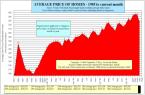
Average prices year over year were up BUT the average price dropped from $919,614 in April to $863,910 in May.  This is highly unusual for average prices to drop in the period April to May.  Generally the average price increases during this period and has increased over the past 8 years except in 2012 where it dropped marginally.  This year the drop from April to May was about 6%

See the graph of average prices by clicking the image below.


The full report is below

I wish you all the best!
Mark


Active Listings Increase in May

TORONTO, June 5, 2017 – Toronto Real Estate Board President Larry Cerqua announced that Greater Toronto Area REALTORS® reported 10,196 sales through TREB’s MLS® System in May 2017 – down by 20.3 per cent compared to 12,790 sales reported in May 2016.

Sales of detached homes were down by 26.3 per cent. Sales of condominium apartments were down by 6.4 per cent.

Active listings – the number of properties available for sale at the end of May – were up by 42.9 per cent compared to the lowest level in 15 years recorded in May 2016, but remained below the average and peak during that period. The number increased considerably for low-rise home types including detached and semi-detached houses and townhouses. Active listings for condominium apartments were down compared to May 2016.

“Home buyers definitely benefitted from a better supplied market in May, both in comparison to the same time last year and to the first four months of 2017. However, even with the robust increase in active listings, inventory levels remain low. At the end of May, we had less than two months of inventory. This is why we continued to see very strong annual rates of price growth, albeit lower than the peak growth rates earlier this year,” said Mr. Cerqua.

Selling prices continued to increase strongly in May compared to the same month in 2016. The MLS® HPI Composite Benchmark price was up by 29 per cent year-over-year. The average selling price for all home types combined for the TREB Market Area as a whole was up by 14.9 per cent to $863,910. Year-over-year price increases were greater for condominium apartments compared to low-rise home types.

This likely reflects the fact that the low-rise market segments benefitted most from the increase in listings.

“The actual, or normalized, effect of the Ontario Fair Housing Plan remains to be seen. In the past, some housing policy changes have initially led to an overreaction on the part of homeowners and buyers, which later balanced out. On the listings front, the increase in active listings suggests that homeowners, after a protracted delay, are starting to react to the strong price growth we’ve experienced over the past year by listing their home for sale to take advantage of these equity gains,” said Jason Mercer, TREB’s Director of Market Analysis.


I hope this finds you Happy and Healthy!
All the Best!
Mark
A. Mark Argentino
P. Eng. Broker
Specializing in Residential & Investment Real Estate

RE/MAX Realty Specialists Inc.
Providing Full-Time Professional Real Estate Services since 1987

BUS 905-828-3434
FAX 905-828-2829  CELL 416-520-1577
mark@mississauga4sale.com

Mississauga4Sale.com


Thursday, April 13, 2017

Real Estate Prices continue their upward march in March of 2017

Greetings from Fabulous Mississauga!
  • The average selling price last month was $916,567 (it was $688,011 in March of 2016 - over 30% increase year over year), and it was $876,186 the previous month.see graph of prices here
  • Greater Toronto Area REALTORS® reported 12,077 residential sales through TREB’s MLS® System in March 2017. This result represented a 17.7 per cent increase compared to the 10,260 sales reported in March 2016.
  • The Bank of Canada Prime Lending Rate now stands at 2.70% steady (since July 2015) read more

The statistics for last month are out, the figures for previous month are out and average GTA sale price and volumes continue to be at or near all time highs, see this page for latest market stats and results from the previous month


Toronto Real Estate Board (TREB) Average Prices and Graph

For more information please contact A. Mark Argentino

A. Mark Argentino, Broker, P.Eng.,
Specializing in Residential & Investment Real Estate
RE/MAX Realty Specialists Inc., Brokerage
2691 Credit Valley Road, Suite 101, Mississauga, Ontario L5M 7A1
BUS. 905-828-3434
FAX. 905-828-2829
E-MAIL: mark@mississauga4sale.com
Website: Mississauga4Sale.com

Tuesday, March 07, 2017

Real Estate Prices UP by nearly 28% in the GTA Real Estate Marketplace


Greetings from Fabulous Mississauga!

click this image to see a graph of real estate prices
  • The average selling price last month was $875,983 (it was $770,745 the previous month) compared to January of last year. and this represents aver a 27.7% increase compared to the same month last year- see graph of prices here
  • The overall average selling price for calendar year 2016 was $729,922 – up 17.3 per cent compared to 2015
  • Greater Toronto Area REALTORS® reported 8,014 residential transactions through TREB's MLS® System last month. This result was up by 5.7 per cent compared to the same month last year
  • The Bank of Canada Prime Lending Rate now stands at 2.70% steady (since July 2015) read more
The statistics for last month are out, the figures for previous month are out and average GTA sale price and volumes continue to be at or near all time highs, see this page for latest market stats and results from the previous month

Mortgage Interest Rates - time to lock in? read more


Once again, last month was another very strong month for sales and prices in the GTA.
TREB reports that the volume of sales was down but prices are up year over year. 


All the best!
Mark


Friday, May 06, 2016

Graph showing TREB Historical Average Price Data

Greeting from Fabulous Mississauga!

Below is a Graph showing TREB Historical Average Price Data

  • The graph below shows a graph of sales price data obtained directly from the Toronto Real Estate Board showing the average selling price of single family homes from 1985 to date in our GTA marketplace.
  • Note the historical trends for spring and fall price increases, where spring typically has a larger increase compared to the fall.
  • The benchmark for changes in price is chosen to be the average price of homes at the last height of the market, which was $273,698 in 1989


I hope this finds you Happy and Healthy!
All the Best!
Mark
A. Mark Argentino
P. Eng. Broker
Specializing in Residential & Investment Real Estate

RE/MAX Realty Specialists Inc.
Providing Full-Time Professional Real Estate Services since 1987

BUS 905-828-3434
FAX 905-828-2829  CELL 416-520-1577
mark@mississauga4sale.com

Mississauga4Sale.com


Wednesday, May 04, 2016

Toronto and GTA Home Sales Again at Record Highs for April 2016

Hello from Fabulous Mississauga!

Home sale were at record heights again last month in the GTA

Highlights of the latest report from TREB for the Residential Real Estate Market in the GTA

  • The Average price for last month was $739,082 (it was $688,181 the previous month) and this represents aver a 16.2% increase compared to the same month last year- see graph of prices here
  •  Sales volumes were 12,085 (it was 10,326 last month) and this an 7.4% increase from the same month last year 
  •  The 2015 calendar year total number of sales was 101,299 – a substantial 9.2 per cent increase compared to 2014 as a whole
  •  There were 22,575 sales in the first quarter of 2016 and the year-over-year growth rate for sales was 15.8 per cent for Q1 2016.
  •  The Bank of Canada Prime Lending Rate now stands at 2.70% steady (since July 2015) 


 See more at this page about average prices and read the TREB full price and data report below.

Read the full report below

See graphs of prices at this page


Record Home Sales in April

TORONTO, May 4, 2016 – Toronto Real Estate Board President Mark McLean announced that there were 12,085 sales reported through TREB’s MLS® System in April 2016. This result, which represented a record for the month of April, was up by 7.4 per cent in comparison to April 2015.

For the TREB market area as a whole, annual sales growth was experienced for all major home types except semi-detached houses. In the City of Toronto, sales were down for detached and semi-detached houses as well as townhouses on a year-over-year basis.

This dip in sales in the ‘416’ area code was due to a lack of low-rise listings. Many would-be buyers were not able to find a home that met their needs.

“While April’s sales result represented a new record for sales, that number could have been even higher if we had benefitted from more supply. In the City of Toronto in particular, some households have chosen not to list their home for sale because of the second substantial Land Transfer Tax and associated administration fee.

The lack of available inventory, coupled with record sales, continued to translate into robust annual rates of price growth,” said Mr. McLean.

Home selling prices continued to trend upward in April. The MLS® Home Price Index Composite Benchmark was up by 12.6 per cent year-over-year.

The average selling price was up by 16.2 per cent. The higher growth rate reported for the average home price, as compared to the MLS® HPI, points to a greater share of high-end home sales this year compared to last.

“As we move into the busiest time of the year, in terms of sales volume, strong competition between buyers will continue to push home prices higher. A greater supply of listings would certainly be welcome, but we would need to see a number of consecutive months in which listings growth outpaced sales growth before market


I hope this finds you Happy and Healthy!
All the Best!
Mark
A. Mark Argentino
P. Eng. Broker
Specializing in Residential & Investment Real Estate

RE/MAX Realty Specialists Inc.
Providing Full-Time Professional Real Estate Services since 1987

BUS 905-828-3434
FAX 905-828-2829  CELL 416-520-1577
mark@mississauga4sale.com

Mississauga4Sale.com


Wednesday, April 06, 2016

Residential Real Estate Market in the GTA April 2016 Highlights of the latest report from TREB

Greetings from Fabulous Mississauga!

Highlights of the latest report from TREB for the Residential Real Estate Market in the GTA

  • The Average price for last month was $688,181 (it was $685,278 the previous month) and this represents aver a 12.1% increase compared to the same month last year- see graph of prices here
  • Sales volumes were 10,326 (it was 7,621 last month) and this an 15.8% increase from the same month last year
  • The 2015 calendar year total number of sales was 101,299 – a substantial 9.2 per cent increase compared to 2014 as a whole
  • There were 22,575 sales in the first quarter of 2016 and the year-over-year growth rate for sales was 15.8 per cent for Q1 2016.
     
  • The Bank of Canada Prime Lending Rate now stands at 2.70% steady (since July 2015) read more


Strong Growth in Home Sales in March/Q1


TORONTO, April 5, 2016 – Toronto Real Estate Board President Mark McLean announced record TREB MLS® home sales for the first quarter of 2016 following a strong result for March transactions.

There were 10,326 sales in March and 22,575 sales in the first quarter.

The year-over-year growth rate for sales was 15.8 per cent for Q1 2016 and 16.2 per cent for March 2016. For the TREB market area as a whole, double-digit year-over-year rates of sales growth were experienced for all major home types during the first quarter.

The positive annual growth in sales was not mirrored on the listings front. The number of new listings entered into TREB's MLS® System during March and the first quarter were down compared to the same periods in 2015.

“At the beginning of 2016, TREB’s outlook for the year pointed to a strong possibility of a second consecutive record year for home sales. This outlook was based, in part, on upbeat consumer survey results pointing to robust home buying intentions. It is clear that these upbeat intentions have translated into record first quarter results,” said Mr. McLean.

The MLS® Home Price Index Composite Benchmark for March 2016 was up by 11.6 per cent compared to March 2015.

The average selling price for all home types combined was up 12.1 per cent year-over-year in March and 13.6 per cent in the first quarter.

“Demand was clearly not an issue in the first three months of 2016, regardless of the housing market segment being considered. The supply of listings, however, continued to aggravate many would-be home buyers. We could have experienced even stronger sales growth were it not for the constrained supply of listings, especially in the low-rise market segments.

The resulting strong competition between buyers has underpinned the double-digit rates of price growth experienced so far this year," said Jason Mercer, TREB’s Director of Market Analysis.


I hope this finds you Happy and Healthy!
All the Best!
Mark
A. Mark Argentino
P. Eng. Broker
Specializing in Residential & Investment Real Estate

RE/MAX Realty Specialists Inc.
Providing Full-Time Professional Real Estate Services since 1987

BUS 905-828-3434
FAX 905-828-2829  CELL 416-520-1577
mark@mississauga4sale.com

Mississauga4Sale.com


Monday, June 08, 2015

June 2015 Market Watch Report for Toronto and GTA - sales figures are in for last month

Hello from Beautiful Mississauga!

The Toronto Real Estate Board released its latest figures for the Toronto and GTA real estate marketplace.
  • The Average price for last month was $649,599 (it was $613,933 the previous month) and this represents aver a 11% increase compared to the same month last year- see graph of prices here
  • Sales volumes were 11,706 (it was 8,940 last month) and this is UP 6.3% from the same month last year 
  •  The Bank of Canada Prime Lending Rate shocked the experts and lowered the rate to 2.75% in January 2015 read more


Read more about average prices and read the TREB full price and data report below.


This is the press release from TREB

All the best!
Mark


A New Sales Record for the Month of May


June 3, 2015 -- Toronto Real Estate Board President Paul Etherington announced 11,706 sales reported by Greater Toronto REALTORS® in May 2015. This result was up by 6.3 per cent in comparison to 11,013 sales reported in May 2014. For the TREB market area as a whole, sales were up for all major housing types. However, in the City of Toronto, where the supply of low-rise listings has been constrained, sales were down for detached homes.


“During my tenure as TREB President over the past year, it is clear to me that ownership housing remains top of mind as a quality long-term investment for GTA households. This is why, despite a shortage of listings in some market segments, we experienced a record number of sales reported through TREB’s MLS® System for the month of May,” said Mr. Etherington.


Record May transactions, coupled with a dip in the number of homes available for sale, resulted in strong price growth. The MLS® Home Price Index (HPI) Composite Benchmark was up by 8.9 per cent year over year in May. The MLS® HPI uses benchmark homes to estimate price growth. This allows for an “apples to apples” comparison of price growth that is not affected by changes in the mix of sales activity.


The average selling price for all home types combined in May 2015 was up by 11 per cent annually to $649,599. The higher annual rate of average price growth compared to the MLS® HPI Composite Benchmark points to the fact that the proportion of high-end home sales continued to be greater compared to 2014.


“Tight market conditions, especially for singles, semis and town homes in the GTA, have resulted in strong price growth regardless of the price metric being considered. With no relief so far on the listings front, expect similar rates of price growth as we move through the remainder of 2015. At this point, a number of months where listings growth outstrips sales growth would be required to satisfy pent-up demand,” said Jason Mercer, TREB’s Director of Market Analysis.


I hope this finds you Happy and Healthy!
All the Best!
Mark
A. Mark Argentino
P. Eng. Broker
Specializing in Residential & Investment Real Estate

RE/MAX Realty Specialists Inc.
Providing Full-Time Professional Real Estate Services since 1987

BUS 905-828-3434
FAX 905-828-2829  CELL 416-520-1577
mark@mississauga4sale.com

Mississauga4Sale.com
  • Thinking of selling your home in the next 3 to 6 months?  Would you like a Complimentary & Quick Over-The-Net Home Evaluation ?
    www.mississauga4sale.com/internet-evaluation.htm
  • Power of Sales and Foreclosureswww.mississauga4sale.com/Power-Sales-Bank-Sales-Alert-Request.htm
  • If you have not already signed up to receive my monthly real estate newsletter, you may do so here: On-Line Real Estate Newsletter sign up
    www.mississauga4sale.com/popupquestion.htm
  • See seasonal housing patternswww.mississauga4sale.com/TREBprice.htm
  • Would you like me to send you a desk or wall Calendar?
    www.mississauga4sale.com/Calendar-Order-Form.htm


Thursday, May 07, 2015

Another record setting month on the Toronto Real Estate Board for Residential Real Estate Sales

Greetings from Fabulous Mississauga!

We just experienced another record setting month on the Toronto Real Estate Board for residential real estate sales.  The number of sales was 11,303, 17% higher than same month last year.  Average prices are also at all time highs.

  • The Average price for last month was $635,932 (it was $613,933 the previous month) and this represents aver a 10% increase compared to the same month last year- see graph of prices here
  •  Sales volumes were 11,303 (it was 8,940 last month) and this is UP 17% from the same month last year 
  •  The Bank of Canada Prime Lending Rate steady at 2.75% read more


Below is the full price and data report from TREB for last month

Record Sales in April 2015

TORONTO, May 5, 2015 – Toronto Real Estate Board President Paul Etherington announced that Greater Toronto Area REALTORS® reported 11,303 sales in April 2015.

This was the highest sales result on record for the month of April and represented a 17 per cent increase in comparison to April 2014. While sales increased strongly on a year-over-year basis, new listings were up over the same period by a more moderate five per cent.

“The record April result clearly points to the fact that a growing number of GTA households view ownership housing as a high quality, long-term investment. This is evidenced by the strong sales growth we have experienced in Toronto and surrounding regions for all major home types.

First time buyers and existing homeowners remain very active in today’s market,” said Mr. Etherington.

The overall average selling price, which accounts for all homes reported sold by GTA REALTORS® in April 2015, was up by 10 per cent year-over-year to $635,932. The MLS® Home Price Index (HPI) Composite Benchmark, which estimates the price of a benchmark home with the same attributes from one period to the next, was up by 8.4 per cent over the same period.

The fact that average price growth outpaced growth for the MLS® HPI Composite Benchmark, suggests that a greater share of higher-end homes changed hands this year compared to last.

Irrespective of the indicator used, price growth in the GTA was strongest for low-rise home types. However, the better supplied condominium apartment segment also remained healthy with price growth above the rate of inflation.

“Demand for ownership housing was very high relative to the number of homes available for sale in April. This situation is not expected to change markedly as we move through the remainder of 2015. Until we experience a sustained period in which listings grow at a faster pace than sales, annual rates of home price growth will remain strong,” said Jason Mercer, TREB’s Director of Market Analysis.


All the Best!

Mark

I hope this finds you Happy and Healthy!
All the Best!
Mark
A. Mark Argentino
P. Eng. Broker
Specializing in Residential & Investment Real Estate

RE/MAX Realty Specialists Inc.
Providing Full-Time Professional Real Estate Services since 1987

BUS 905-828-3434
FAX 905-828-2829  CELL 416-520-1577
mark@mississauga4sale.comMississauga4Sale.com
  • Thinking of selling your home in the next 3 to 6 months?  Would you like a Complimentary & Quick Over-The-Net Home Evaluation ?
    www.mississauga4sale.com/internet-evaluation.htm
  • Power of Sales and Foreclosureswww.mississauga4sale.com/Power-Sales-Bank-Sales-Alert-Request.htm
  • If you have not already signed up to receive my monthly real estate newsletter, you may do so here: On-Line Real Estate Newsletter sign up
    www.mississauga4sale.com/popupquestion.htm
  • See seasonal housing patternswww.mississauga4sale.com/TREBprice.htm
  • Would you like me to send you a desk or wall Calendar?
    www.mississauga4sale.com/Calendar-Order-Form.htm
 

Monday, April 13, 2015

Number of High-Rise Condominiums and Townhomes for sale in the Square One City Centre Area and the Central Erin Mills area of Mississauga

There are many high-rise condos and townhomes for sale in the central City Centre (Square One) and Central Erin Mills areas of Mississauga - as of April 13, 2015 

This area is bounded by 403 to Webb Drive, Confederation to just east of Robert Speck Parkway, see the map below for exact boundaries.

The number of condos for sale in the City Centre area of Mississauga are:
·         bachelor condos for sale - 10
·         1 bedroom condos for sale - 208
·         2 bedroom condos for sale - 222
·         3 bedroom condos for sale - 12

The number of townhomes for sale in the City Centre area of Mississauga are:
·         bachelor condos for sale - 0
·         1 bedroom townhomes for sale - 7
·         2 bedroom townhomes for sale - 14
·         3 bedroom townhomes for sale - 8

Central Erin Mills is bounded by Britannia and the 403, Winston Churchill to Erin Mills on the east from Britannia to Thomas, then Thomas approximately over to the Credit river, see the map below

The number of condos for sale in the Central Erin Mills area of Mississauga are:
·         bachelor condos for sale - 0
·         1 bedroom condos for sale - 9
·         2 bedroom condos for sale - 10
·         3 bedroom condos for sale - 1

The number of Townhomes for sale in the Central Erin Mills area of Mississauga are:
·         bachelor condos for sale - 0
·         1 bedroom townhomes for sale - 1
·         2 bedroom townhomes for sale - 1
·         3 bedroom townhomes for sale - 16
·         4 bedroom townhomes for sale - 0

I will update this number from time to time to see if there is any trend up or down over time.

Have a great day!
Mark

City Centre Boundaries below

Central Erin Mills Boundaries below

Friday, April 10, 2015

April 2015 Real Estate Market in Mississauga and the GTA Highlights All sales graphs pricing data

Highlights from April 2015 Real Estate Market in Mississauga and the GTA

April 2015 News 

Greetings from Fabulous Mississauga!

  • The Average price for last month  was $613,933 (it was $596,163 the previous month) and this represents aver a 10% increase compared to the same month last year-see graph of prices here
  • Sales volumes were 8,940 (it was 6,338 last month) and this is UP 11% from the same month last year 
  • The Bank of Canada Prime Lending Rate recently dropped to 2.75% read more


All the best!
Mark

This is the full press release for results from last month

TORONTO, April 7, 2015 –
Toronto Real Estate Board President Paul Etherington announced that Greater Toronto Area REALTORS® reported 8,940 sales in March 2015.

This result represented an 11 per cent increase compared to March 2014. Sales were up for most major home types, both in the City of Toronto and the surrounding regions. New listings were also up, but by a lesser 5.5 per cent, indicating tighter market conditions.

“Home sales increased compared to last year as the cost of home ownership remained affordable, with lower interest rates going a long way to mitigate the effect of rising home prices. However, a substantial amount of pent-up demand remains in place, especially as it relates to low-rise market segments.

This suggests that strong competition between buyers, which has fuelled strong price growth so far this year, will continue to be experienced throughout the spring,” said Mr. Etherington. In March, the average selling price for all reported transactions was $613,933 – up 10 per cent year-over-year.

The MLS® HPI Composite Index, which tracks benchmark homes with the same attributes from one period to the next, was up by 7.9 per cent. Average price growth was strongest for detached homes in the City of Toronto, at 15.9 per cent.

Over the same period the detached MLS® HPI in the '416' area code increased 7.8 per cent. The MLS® HPI provides a clear indication of price growth due to market forces - the relationship between demand and supply.

Comparing MLS® HPI growth to average price growth provides a sense of the changing mix of home types sold from one period to the next. "It is clear that seller's market conditions in many parts of the GTA are driving price growth.

However, looking at the detached market segment in the City of Toronto in particular, growth in the average selling price outstripped growth in the MLS® HPI.

This points to the fact that the mix of detached homes sold this year compared to last has shifted towards more expensive properties," said Jason Mercer, TREB's Director of Market Analysis.

I hope this finds you Happy and Healthy!
All the Best!
Mark
A. Mark Argentino
P. Eng. Broker
Specializing in Residential & Investment Real Estate

RE/MAX Realty Specialists Inc.
Providing Full-Time Professional Real Estate Services since 1987

BUS 905-828-3434
FAX 905-828-2829  CELL 416-520-1577
mark@mississauga4sale.comMississauga4Sale.com
  • Thinking of selling your home in the next 3 to 6 months?  Would you like a Complimentary & Quick Over-The-Net Home Evaluation ?
    www.mississauga4sale.com/internet-evaluation.htm
  • Power of Sales and Foreclosureswww.mississauga4sale.com/Power-Sales-Bank-Sales-Alert-Request.htm
  • If you have not already signed up to receive my monthly real estate newsletter, you may do so here: On-Line Real Estate Newsletter sign up
    www.mississauga4sale.com/popupquestion.htm
  • See seasonal housing patternswww.mississauga4sale.com/TREBprice.htm
  • Would you like me to send you a desk or wall Calendar?
    www.mississauga4sale.com/Calendar-Order-Form.htm