Showing posts with label house-trends. Show all posts

Tuesday, February 07, 2012

Basement Apartments are now legal in Ontario due to Bill 140

Another huge change in Ontario that was just announced is in Bill 140 which has one change in housing.

From now onwards, if a property meets building code and Fire Safety standards, you can legalize any second dwelling in a single family home.

This means that basement apartments have become legal again and this will allow many people who can't afford to purchase a home to get into the market because they can earn income from a basement apartment, legally.

This means the banks will give a mortgage partly based upon current or expected income from the basement apartment and this means that demand will increase and prices will likely follow!


Toronto Real Estate Board (TREB) Average Prices and Graph

For more information please contact A. Mark Argentino

A. Mark Argentino, Broker, P.Eng.,
Specializing in Residential & Investment Real Estate
RE/MAX Realty Specialists Inc., Brokerage
2691 Credit Valley Road, Suite 101, Mississauga, Ontario L5M 7A1
BUS. 905-828-3434
FAX. 905-828-2829
E-MAIL: mark@mississauga4sale.com
Website: Mississauga4Sale.com

Thursday, January 12, 2012

Months of Inventory (MOI) Indicator Toronto Real Estate Board now calculating and publishing

The Toronto Real Estate Board has just released a new indicator of the market. It's called a Months of Inventory indicator. It's calculated by dividing the previous 12 month average # of active listings by the previous 12 month average number of sales. The result is the average time to sell an actively listed property!


TREB Publishing New Months of Inventory Indicator

January 9, 2012 -- Happy New Year! I hope all TREB Members had a restful holiday season after a very busy 2011. Just to recap, we had the second-best year on record in terms of sales (89,347) and the average selling price rose by eight per cent to $465,412. At the same time, total new listings for the year were down by almost four per cent.

The supply side of the market was the big story over the last 12 months. I am guessing that many TREB Members had clients who faced significant competition from other Buyers when trying to get a deal done on a home. On the flip side, I am guessing that many Members also had listings that attracted substantial interest and sold in short order for a good price.


What I am describing here is a typical Sellers' market: lots of Buyers, a shortage of listings and strong price growth.


TREB is now publishing a Months of Inventory (MOI) indicator to help Members and the public get a better handle on market conditions. MOI is also published at the national scale in Canada by CREA and in the United States by NAR. I want to briefly explain how this new indicator works and then give some examples of its use.

MOI is calculated by dividing the 12-month average for active listings by the 12-month average for sales. The result tells us how long it would have taken, on average, to sell all actively listed homes. As of the end of December, this number was 2.2 months. If, moving forward, we see the MOI trend upwards this would suggest that the market is becoming better supplied and we may see less upward pressure on price. If we see the indicator trend lower, this would suggest that market conditions are tightening and strong upward pressure will continue to be exerted on price.

In the post-recession period, MOI has hovered in the 2.0 to 2.5 month range.


This is substantially lower than the pre-recession norm of between 3.0 and 3.5 month range. When we look at market conditions in this context, it is easy to see why we have seen above average price growth over the last couple of years - eight per cent last year following nine per cent in 2010.


We can also use MOI to compare different municipalities in the GTA. A look at the MOI column on pages 3 and 4 of the December Market Watch shows us that the relationship between sales and listings varies quite a bit across the region - from a low of 1.2 months to a high of over nine months.

The MOI can also help us position the GTA within the national context.


According to CREA, MOI was 7.4 months for Canada and 4.8 months for Ontario in November versus 2.2 months for the GTA. This may suggest that the GTA market is tighter than the national and Ontario averages. With this in mind, it is not surprising that year-to-date average price growth for the GTA was in the upper third of Canadian metropolitan areas.


However, when making these types of comparisons it is important to bear in mind that each market area has evolved differently over time. So, while a more balanced market in Toronto may be associated with MOI of 3.5, other markets may be characterized by a MOI of six months.


As we move through 2012, we should expect to see the MOI start to increase.


The strong price growth we have seen over the last year should prompt more households to list. In fact, we have started to see year-over-year growth in new listings outstrip growth in sales in many parts of the GTA. If this trend continues, we will likely see the annual rate of price growth moderate into the mid-single-digits.


I hope this finds you Happy and Healthy!

All the Best!

Mark

A. Mark Argentino
P. Eng. Broker
Specializing in Residential & Investment Real Estate
RE/MAX Realty Specialists Inc.
Providing Full-Time Professional Real Estate Services since 1987
BUS 905-828-3434
FAX 905-828-2829 CELL 416-520-1577
mark@mississauga4sale.com
Mississauga4Sale.com

* Thinking of selling your home in the next 3 to 6 months? Would you
like a Complimentary & Quick Over-The-Net Home Evaluation ?
www.mississauga4sale.com/internet-evaluation.htm


* Power of Sales and Foreclosures
www.mississauga4sale.com/Power-Sales-Bank-Sales-Alert-Request.htm


* If you have not already signed up to receive my monthly real estate
newsletter, you may do so here: On-Line Real Estate Newsletter sign up
www.mississauga4sale.com/popupquestion.htm


* See seasonal housing patterns
www.mississauga4sale.com/TREBprice.htm


* Would you like me to send you a desk or wall Calendar?
www.mississauga4sale.com/Calendar-Order-Form.htm

Wednesday, January 11, 2012

This is the report for latest month in real estate sales from the Toronto real estate board and indicates a 'normal' amount of activity and price levels.

You will find all the latest figures and graphs summarizing last years real
estate market at this page:

http://www.mississauga4sale.com/TREBprice.htm

This is the report for latest month in real estate sales from the Toronto
real estate board and indicates a 'normal' amount of activity and price
levels.

All the best!
Mark


The year end figures for GTA residential home sales were just published.
2011 was the second best year on record with nearly 90,000 sales up about 4%
compared to 2010

Average price for 2011 was $465,412 up about 8% compared to the 2010 average
of $431,276

See the full press release below and I will update all my graphs and
information on my website at http://www.mississauga4sale.com/TREBprice.htm
in the next couple of days.

I wish you all the best in 2012!

Mark

Thursday, January 05, 2012

8 Per Cent Price Increase for Toronto and GTA residential home sales for 2011

The year end figures for GTA residential home sales were just published.
2011 was the second best year on record with nearly 90,000 sales up about 4% compared to 2010

Average price for 2011 was $465,412 up about 8% compared to the 2010 average of $431,276

See the full press release below and I will update all my graphs and information on my website at http://www.mississauga4sale.com/TREBprice.htm in the next couple of days.

I wish you all the best in 2012!

Mark


GTA REALTORS(r) RELEASE MONTHLY RESALE MARKET FIGURES

TORONTO, January 5, 2012 - Greater Toronto REALTORS(r) reported 4,718
transactions through the TorontoMLS(r) system in December 2011. The December
result capped off the second-best year on record under the current Toronto
Real Estate Board (TREB) boundaries. Total sales for 2011 amounted to 89,347
- up four per cent in comparison to 2010.

"Low borrowing costs kept Buyers confident in their ability to comfortably
cover their mortgage payments along with other major housing costs," said
TREB President Richard Silver. "If Buyers had not been constrained by a
shortage of listings over the past 12 months, we would have been flirting
with a new sales record in the Greater Toronto Area," added Silver.

The average selling price in December was $451,436 - up four per cent
compared to December 2010. For all of 2011, the average selling price was
$465,412, an increase of eight per cent in comparison to the average of
$431,276 in 2010.

"Months of inventory remained below the pre-recession norm in 2011. Very
tight market conditions meant substantial competition between Buyers and
strong upward pressure on selling prices," said Jason Mercer, TREB's Senior
Manager of Market Analysis.


"TREB's baseline forecast for 2012 is for an average price of $485,000,
representing a more moderate four per cent annual rate of price growth. This
baseline view is subject to a heightened degree of risk given the uncertain
global economic outlook," continued Mercer. Summary of TorontoMLS(r) Sales
and Average Price


December 1-31

2011

2010


Sales

Ave. Price

Sales

Ave. Price


City of Toronto "416"

1,948

$474,270

1,818

$463,580


Rest of GTA "905"

2,770

$435,378

2,468

$411,383


GTA

4,718

$451,436

4,286

$433,523


TorontoMLS(r) Sales & Average Price By Home Type


December 1-31, 2011

Sales

Ave. Price


416

905

Total

416

905

Total


Detached

581

1,512

2,093

701,846

525,360

574,351


Yr./Yr. % Change

4%

12%

10%

3%

4%

3%


Semi-Detached

202

289

491

517,152

365,417

427,842


Yr./Yr. % Change

20%

12%

15%

10%

9%

10%


Townhouse

199

517

716

372,164

333,359

344,144


Yr./Yr. % Change

3%

20%

15%

-7%

8%

2%


Condo Apartment

943

363

1,306

351,104

275,173

330,000


Yr./Yr. % Change

7%

-3%

4%

3%

9%

5%

Tuesday, December 06, 2011

November GTA Real Estate Sales statistics from TREB

this is the report from the Toronto Real Estate Board for last months sales figures in the GTA

The Average price was $480,421 up nearly 10% compared to November 2010
The total number of sales was 7,092 up 11% compared to November 2010

See the full report below,
Mark


Healthy Fall Market Continues in November

Toronto, December 6, 2011 - Greater Toronto REALTORS(r) reported 7,092 residential transactions through the TorontoMLS(r) system in November - up 11 per cent in comparison to November 2010. At the same time, the number of new listings was up by 14 per cent in comparison to last year.

"We have seen strong annual sales growth through the 2011 fall market. The increase in transactions has been broad-based, with strong growth across low-rise and high-rise home types throughout the Greater Toronto Area," said Toronto Real Estate Board (TREB) President Richard Silver.


"The market has also become better supplied, with annual new listings growth outstripping that of sales. As this trend continues into 2012, we will see more balanced
market conditions."


The average price for November transactions was $480,421, representing an increase of almost 10 per cent in comparison to $437,494 in November 2010.

"Despite strong price growth this year, the housing market remains affordable in the GTA," said Jason Mercer, TREB's Senior Manager of Market Analysis. "The correct method of assessing affordability is to consider the share of the average household's income that is dedicated to mortgage principal and interest, property taxes and utilities. Currently, this share remains in line with generally accepted lending guidelines. Given this positive affordability picture, average price growth is forecast to continue in 2012, albeit at a more moderate pace."


Read more at TREB Prices


All the best!


Mark

Thursday, November 10, 2011

Greater Toronto REALTORS reported prices up 8 per cent year over year Toronto MLS in October 2011

This is the latest news from the Toronto Real Estate Board on Average sales
volumes and prices, market is very healthy!


Pace of Home Sales Remains Brisk in October

November 3, 2011 -- Greater Toronto REALTORS(r) reported 7,642 home sales
through the TorontoMLS(r) in October 2011. This represented an increase of
17.5 per cent compared to the 6,504 transactions reported in October 2010.

Monthly sales data follow a recurring seasonal trend that should be removed
before comparing monthly results within the same year. After adjusting for
seasonality, the annualized rate of sales for October was 97,100, which was
above the average of 90,700 for the first three quarters of 2011.

"The pace of October resale home transactions remained brisk in the GTA.
This bodes well for a strong finish to 2011," said Toronto Real Estate Board
President Richard Silver. "Home buyers who found it difficult to make a deal
in the spring and summer due to a shortage of listings have benefitted from
increased supply in the fall."

The average selling price through the TorontoMLS(r) in October was $478,137
- up eight per cent compared to October 2010.

"Sellers' market conditions remain in place in many parts of the GTA. The
result has been above-average annual rates of price growth for most home
types," said Jason Mercer, the Toronto Real Estate Board's Senior Manager of
Market Analysis.

"Thanks to low interest rates, strong price growth has not substantially
changed the positive affordability picture in the City of Toronto and
surrounding regions."

I hope this finds you Happy and Healthy!

All the Best!

Mark

A. Mark Argentino
P. Eng. Broker
Specializing in Residential & Investment Real Estate
RE/MAX Realty Specialists Inc.
Providing Full-Time Professional Real Estate Services since 1987
BUS 905-828-3434
FAX 905-828-2829 CELL 416-520-1577
mark@mississauga4sale.com
Mississauga4Sale.com

* Thinking of selling your home in the next 3 to 6 months? Would you
like a Complimentary & Quick Over-The-Net Home Evaluation ?
www.mississauga4sale.com/internet-evaluation.htm


* Power of Sales and Foreclosures
www.mississauga4sale.com/Power-Sales-Bank-Sales-Alert-Request.htm


* If you have not already signed up to receive my monthly real estate
newsletter, you may do so here: On-Line Real Estate Newsletter sign up
www.mississauga4sale.com/popupquestion.htm


* See seasonal housing patterns
www.mississauga4sale.com/TREBprice.htm


* Would you like me to send you a desk or wall Calendar?
www.mississauga4sale.com/Calendar-Order-Form.htm

Wednesday, November 09, 2011

FW: China's Rich

Hi

Interesting trivia tid bit...

There is 960.000 people in China worth more than U$ 1.000.000.
(There are now approx. 272 Billionnaires).

Oddly enough, more than 46 % intend to immigrate.

Reason: There are worried about the security of their assets.

Immigration choices: # 1 - United States, # 2 - Canada.


Let's hope that they all want to invest in real estate in GTA!!

Mark

Tuesday, November 08, 2011

REMAX Report for Greater Toronto Area since year 2000

This is directly from the RE/MAX report on the GTA sales since 200, very interesting trends!

While a surge in new home construction and renovation has buoyed residential housing values across the Greater Toronto Area since 2000, single-detached homes in core neighbourhoods have experienced the greatest pressure on pricing in the past decade.

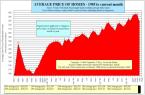
Overall average price in the GTA climbed from $243,255 in 2000 to $431,463 in 2010-an increase of just over 77 per cent (despite an expanded trading area).

Price appreciation has been more pronounced in Toronto district's C01 through 15,E1 through 3, and W1 through 10-where a single-detached home has appreciated by as much as 111 per cent(C11 - Leaside). From 2000 to 2010, residential building permits rose to just over $77 billion-more than doubling values posted in the previous decade.

Close to $6 billion was spent on building permits for renovation purposes during the same period, just a fraction of what is actually attributed to renovation spending in the GTA over the past decade. Infill ll has been a major driver. As such,the landscape of entire communities has changed over"From 2000 to 2010, the value of residential building permits rose to just over $77 billion."

the last decade, as larger homes and townhouse developments replace bungalows, storey-and-a-halves, and two storey properties. The trend is evident throughout the Greater Toronto Area-from Oakville to the Beach and all points north. Even the most prestigious addresses can present redevelopment opportunities-the Bridle Path is case in point where many of the smaller ranch-style bungalows sitting on two and three acres lots have been demolished to make way for 18,000 sq. ft. mansions.

With a disposal bin on what seems like every second driveway, homeowners have also been on a renovation tear in recent years. Approximately 35 per cent of the city's owned housing stock (Statistics Canada) was constructed prior to 1970. While maintenance and repair are a given for many, some buyers are taking their homes to the studs.The Greater Toronto Area is growing-and nowhere is that more evident than in the core. Sales of single-family dwellings have increased 54 per cent in the last 10 years,rising from 18,405 sales in 2000 to 28,387 in 2010.Condominiums have been in large part responsible for the upswing in sales - with renewed focus on higher density development in downtown Toronto.

Sales in C01 alone-the vast majority of which are condominium apartments and townhomes-have experienced a 212 per cent increase in the number of units sold between 2000 and 2010. With prices of single-detached product rising across the Greater Toronto Area, condominiums now represent the first - step to homeownership.

Trendy new condo enclaves have resurrected tired, older communities and given them a new lease on life. King St.West is leading the way, with Queen St. in hot pursuit.While affordability has driven the condominium lifestyle to a large extent-affluent empty nesters and retirees have been drawn to prestige developments in the city, including but not limited to the Ritz Carlton Residences, the Four Seasons Residences, the Hazelton,Shangri-La and the Trump Tower.

The most expensive sale - condo or single-family-has been the penthouse of the Four Seasons, with a sale price of $28 million-shattering all existing records to date. And while there are thousands of units coming on-stream in the year's ahead, absorption is not expected to be an issue.

Apartments that are not occupied by end users will likely end up in a rental pool. Vacancy rates in the city are trending lower, population is on the upswing in the GTA-rising almost 10 per cent from 2001 to 2006 and climbing,and new rental apartments are few and far between.

The future is bright for residential real estate in Canada's largest centre.

Economic fundamentals remain sound,with GDP growth expected to improve, and employment numbers on the upswing. Interest rates are forecast to remain stable, which should also serve to bolster homebuying activity in the months ahead. With inventory levels tighter than usual, continued upward pressure on pricing is a given.

Who says we are in a bubble? It appears to be real growth and the trend is continuing into this decade too!


I hope this finds you Happy and Healthy!

All the Best!

Mark

A. Mark Argentino
P. Eng. Broker
Specializing in Residential & Investment Real Estate
RE/MAX Realty Specialists Inc.
Providing Full-Time Professional Real Estate Services since 1987
BUS 905-828-3434
FAX 905-828-2829 CELL 416-520-1577
mark@mississauga4sale.com
Mississauga4Sale.com

* Thinking of selling your home in the next 3 to 6 months? Would you
like a Complimentary & Quick Over-The-Net Home Evaluation ?
www.mississauga4sale.com/internet-evaluation.htm


* Power of Sales and Foreclosures
www.mississauga4sale.com/Power-Sales-Bank-Sales-Alert-Request.htm


* If you have not already signed up to receive my monthly real estate
newsletter, you may do so here: On-Line Real Estate Newsletter sign up
www.mississauga4sale.com/popupquestion.htm


* See seasonal housing patterns
www.mississauga4sale.com/TREBprice.htm


* Would you like me to send you a desk or wall Calendar?
www.mississauga4sale.com/Calendar-Order-Form.htm

Monday, November 07, 2011

I wish I would have taken his advice starting 25 years ago!

Unfortunately, I began investing in the stock market with my RSP's beginning
in 1981 and have contributed as much as I could over the past 30 years into
my RSP's. I checked the value last week and my entire RSP portfolio and the
returns are bleak, absolutely terrible. And these are all 'quality' mutual
funds. Ya right.

Every time I had 20% downpayment I should have purchased an investment
property rather than putting money into my RSP's I too "bought in" to that
philosophy, too bad. You can bet my son's won't follow my footsteps on this
one!

Read below what RE/MAX is showing as increases of house prices very RSP's,
you will be shocked!

Housing evolution driving average price appreciation in Canada's major
centres


Mississauga, ON (November 7, 2011) -- Billions spent in new construction,
renovation, and infill over the past decade have contributed to a serious
upswing in the calibre of Canada's housing stock, propping up residential
average price in the country's major centres,
<pdf housing report> according to a report released today by RE/MAX (pdf).

Since 2000, the value of a Canadian home has doubled, rising from $163,951
to $339,030 in 2010. Nowhere has the upswing been better captured than in
both the value of residential building permits issued nationally between
2000 and 2010 - at $340 billion - and the estimated $450 billion spent in
renovation. The impact of these two forces alone has fuelled the Canadian
residential real estate market - as well as the construction industry - for
more than 10 years.

As a result, investment in Canada's housing stock is at an all-time high in
the 16 Canadian residential real estate markets examined in the RE/MAX
Housing Evolution Report. Higher quality housing translated into
extraordinary price appreciation across the country - with 62 per cent (10
markets) experiencing increases in excess of 100 per cent since 2000.

I hope this finds you Happy and Healthy!

All the Best!

Mark

A. Mark Argentino
P. Eng. Broker
Specializing in Residential & Investment Real Estate
RE/MAX Realty Specialists Inc.
Providing Full-Time Professional Real Estate Services since 1987
BUS 905-828-3434
FAX 905-828-2829 CELL 416-520-1577
mark@mississauga4sale.com
Mississauga4Sale.com

* Thinking of selling your home in the next 3 to 6 months? Would you
like a Complimentary & Quick Over-The-Net Home Evaluation ?
www.mississauga4sale.com/internet-evaluation.htm


* Power of Sales and Foreclosures
www.mississauga4sale.com/Power-Sales-Bank-Sales-Alert-Request.htm


* If you have not already signed up to receive my monthly real estate
newsletter, you may do so here: On-Line Real Estate Newsletter sign up
www.mississauga4sale.com/popupquestion.htm


* See seasonal housing patterns
www.mississauga4sale.com/TREBprice.htm


* Would you like me to send you a desk or wall Calendar?
www.mississauga4sale.com/Calendar-Order-Form.htm

Friday, September 09, 2011

Toronto Real Estate Board September 2011 GTA real estate market news

Below is the latest news from the Toronto Real Estate Board and shows that the real estate market in the GTA continues to be quite strong.


GTA REALTORS® REPORT AUGUST RESALE MARKET FIGURES

Toronto, September 7, 2011 – Greater Toronto REALTORS® reported 7,542 sales through the TorontoMLS® system in August – a 24 per cent increase over 6,083 sales in August 2010. New listings, at 12,509, were up by 20 per cent compared to August 2010. Market conditions remained tight as sales growth outstripped growth in new listings.

"Home sales in the GTA have stood up well despite a less certain economic outlook," said Toronto Real Estate Board President Richard Silver. "Home sales will be bolstered by low mortgage rates moving forward. The Bank of Canada is expected to be on the sidelines until the second half of 2012 or even into 2013. However, home ownership affordability in the City of Toronto could be further improved with the removal of the City’s land transfer tax. This tax currently represents a substantial upfront cost for home buyers."

With market conditions remaining tight in the GTA, the average selling price continued to grow strongly in August – up by more than 10 per cent year-over-year to $451,663.

"We remain on pace for the second best year on record for sales. Approximately 90,000 transactions are expected by the end of December," said TREB's Senior Manager of Market Analysis Jason Mercer. "Major home ownership costs, including the average monthly mortgage payment, remain affordable despite the strong price growth experienced so far this year."

I hope this finds you Happy and Healthy!

All the Best!

Mark

A. Mark Argentino
P. Eng. Broker
Specializing in Residential & Investment Real Estate
RE/MAX Realty Specialists Inc.
Providing Full-Time Professional Real Estate Services since 1987
BUS 905-828-3434
FAX 905-828-2829 CELL 416-520-1577
mark@mississauga4sale.com
Mississauga4Sale.com

Thinking of selling your home in the next 3 to 6 months? Would you like a Complimentary & Quick Over-The-Net Home Evaluation ?
www.mississauga4sale.com/internet-evaluation.htm


Power of Sales and Foreclosures
www.mississauga4sale.com/Power-Sales-Bank-Sales-Alert-Request.htm


If you have not already signed up to receive my monthly real estate newsletter, you may do so here: On-Line Real Estate Newsletter sign up
www.mississauga4sale.com/popupquestion.htm


See seasonal housing patterns
www.mississauga4sale.com/TREBprice.htm


Would you like me to send you a desk or wall Calendar?
www.mississauga4sale.com/Calendar-Order-Form.htm


Toronto Real Estate Board (TREB) Average Prices and Graph

For more information please contact A. Mark Argentino

A. Mark Argentino, Broker, P.Eng.,
Specializing in Residential & Investment Real Estate
RE/MAX Realty Specialists Inc., Brokerage
2691 Credit Valley Road, Suite 101, Mississauga, Ontario L5M 7A1
BUS. 905-828-3434
FAX. 905-828-2829
E-MAIL: mark@mississauga4sale.com
Website: Mississauga4Sale.com

Thursday, June 30, 2011

TREB Single Family Residential Sales June 2011 Housing Market Indicators

TREB Single Family Residential Sales June 2011 Housing Market Indicators


Toronto Real Estate Board (TREB) Average Prices and Graph

For more information please contact A. Mark Argentino

A. Mark Argentino, Broker, P.Eng.,
Specializing in Residential & Investment Real Estate
RE/MAX Realty Specialists Inc., Brokerage
2691 Credit Valley Road, Suite 101, Mississauga, Ontario L5M 7A1
BUS. 905-828-3434
FAX. 905-828-2829
E-MAIL: mark@mississauga4sale.com
Website: Mississauga4Sale.com

Wednesday, June 29, 2011

TREB Single Family Residential Sales June 2011 Average and median Price

TREB Single Family Residential Sales June 2011 Average and median Price


Toronto Real Estate Board (TREB) Average Prices and Graph

For more information please contact A. Mark Argentino

A. Mark Argentino, Broker, P.Eng.,
Specializing in Residential & Investment Real Estate
RE/MAX Realty Specialists Inc., Brokerage
2691 Credit Valley Road, Suite 101, Mississauga, Ontario L5M 7A1
BUS. 905-828-3434
FAX. 905-828-2829
E-MAIL: mark@mississauga4sale.com
Website: Mississauga4Sale.com

Tuesday, June 28, 2011

TREB West District June 2011 Days on the Market before sold

TREB West District June 2011 Days on the Market before sold


Toronto Real Estate Board (TREB) Average Prices and Graph

For more information please contact A. Mark Argentino

A. Mark Argentino, Broker, P.Eng.,
Specializing in Residential & Investment Real Estate
RE/MAX Realty Specialists Inc., Brokerage
2691 Credit Valley Road, Suite 101, Mississauga, Ontario L5M 7A1
BUS. 905-828-3434
FAX. 905-828-2829
E-MAIL: mark@mississauga4sale.com
Website: Mississauga4Sale.com

Monday, June 27, 2011

TREB West District June 2011 Sales Active Listing Ratio

TREB West District June 2011 Sales Active Listing Ratio


Toronto Real Estate Board (TREB) Average Prices and Graph

For more information please contact A. Mark Argentino

A. Mark Argentino, Broker, P.Eng.,
Specializing in Residential & Investment Real Estate
RE/MAX Realty Specialists Inc., Brokerage
2691 Credit Valley Road, Suite 101, Mississauga, Ontario L5M 7A1
BUS. 905-828-3434
FAX. 905-828-2829
E-MAIL: mark@mississauga4sale.com
Website: Mississauga4Sale.com

Friday, June 24, 2011

TREB Summary of may Sales and Average Price

TREB Summary of may Sales and Average Price


Toronto Real Estate Board (TREB) Average Prices and Graph

For more information please contact A. Mark Argentino

A. Mark Argentino, Broker, P.Eng.,
Specializing in Residential & Investment Real Estate
RE/MAX Realty Specialists Inc., Brokerage
2691 Credit Valley Road, Suite 101, Mississauga, Ontario L5M 7A1
BUS. 905-828-3434
FAX. 905-828-2829
E-MAIL: mark@mississauga4sale.com
Website: Mississauga4Sale.com

Thursday, June 23, 2011

TREB Single Family Dwelling Sales Comparison June 2011 Average Monthly Prices since January 2010

TREB Single Family Dwelling Sales Comparison June 2011 Average Monthly Prices since January 2010


Toronto Real Estate Board (TREB) Average Prices and Graph

For more information please contact A. Mark Argentino

A. Mark Argentino, Broker, P.Eng.,
Specializing in Residential & Investment Real Estate
RE/MAX Realty Specialists Inc., Brokerage
2691 Credit Valley Road, Suite 101, Mississauga, Ontario L5M 7A1
BUS. 905-828-3434
FAX. 905-828-2829
E-MAIL: mark@mississauga4sale.com
Website: Mississauga4Sale.com

Wednesday, June 22, 2011

TREB Affordability Indicator Share of Average Household Income Used for Mortgage Principal and Interest, Property Taxes and Utilities June 2011

TREB Affordability Indicator Share of Average Household Income Used for Mortgage Principal and Interest, Property Taxes and Utilities June 2011


Toronto Real Estate Board (TREB) Average Prices and Graph

For more information please contact A. Mark Argentino

A. Mark Argentino, Broker, P.Eng.,
Specializing in Residential & Investment Real Estate
RE/MAX Realty Specialists Inc., Brokerage
2691 Credit Valley Road, Suite 101, Mississauga, Ontario L5M 7A1
BUS. 905-828-3434
FAX. 905-828-2829
E-MAIL: mark@mississauga4sale.com
Website: Mississauga4Sale.com

Tuesday, June 21, 2011

TREB Single Family Dwelling Sales Comparison June 2011 Sales

TREB Single Family Dwelling Sales Comparison June 2011 Sales


Toronto Real Estate Board (TREB) Average Prices and Graph

For more information please contact A. Mark Argentino

A. Mark Argentino, Broker, P.Eng.,
Specializing in Residential & Investment Real Estate
RE/MAX Realty Specialists Inc., Brokerage
2691 Credit Valley Road, Suite 101, Mississauga, Ontario L5M 7A1
BUS. 905-828-3434
FAX. 905-828-2829
E-MAIL: mark@mississauga4sale.com
Website: Mississauga4Sale.com

Monday, June 20, 2011

TREB MLS® Sales to New Listings Ratio Monthly with Three Previous Years for Comparison June 2011

TREB MLS® Sales to New Listings Ratio Monthly with Three Previous Years for Comparison June 2011


Toronto Real Estate Board (TREB) Average Prices and Graph

For more information please contact A. Mark Argentino

A. Mark Argentino, Broker, P.Eng.,
Specializing in Residential & Investment Real Estate
RE/MAX Realty Specialists Inc., Brokerage
2691 Credit Valley Road, Suite 101, Mississauga, Ontario L5M 7A1
BUS. 905-828-3434
FAX. 905-828-2829
E-MAIL: mark@mississauga4sale.com
Website: Mississauga4Sale.com

Friday, June 17, 2011

TREB MLS® Average Price Monthly Time Series with Trend Line Actual June 2011

TREB MLS® Average Price Monthly Time Series with Trend Line Actual June 2011


Toronto Real Estate Board (TREB) Average Prices and Graph

For more information please contact A. Mark Argentino

A. Mark Argentino, Broker, P.Eng.,
Specializing in Residential & Investment Real Estate
RE/MAX Realty Specialists Inc., Brokerage
2691 Credit Valley Road, Suite 101, Mississauga, Ontario L5M 7A1
BUS. 905-828-3434
FAX. 905-828-2829
E-MAIL: mark@mississauga4sale.com
Website: Mississauga4Sale.com