Thursday, January 06, 2011

Median Price for real estate in the GTA

Median Price for real estate in the GTA
In December 2010, the median price was $355,000, from the $349,000 recorded during December of 2009.

Toronto Real Estate Board (TREB) Average Prices and GraphFor more information please contact A. Mark ArgentinoA. Mark Argentino, Broker, P.Eng.,Specializing in Residential & Investment Real EstateRE/MAX Realty Specialists Inc., Brokerage2691 Credit Valley Road, Suite 101, Mississauga, Ontario L5M 7A1BUS. 905-828-3434FAX. 905-828-2829E-MAIL: mark@mississauga4sale.comWebsite: Mississauga4Sale.com

GTA MLS December and Year End Toronto Real Estate Board on the GTA real estate marketplace Monthly Resale Housing Market

This is the latest report from the Toronto Real Estate Board on the GTA real estate marketplace

All the best!
Mark


GTA REALTORS(r) Report Monthly Resale Housing Market Figures

TORONTO, January 6, 2011 -- Greater Toronto REALTORS(r) reported 4,395 existing home sales for the month of December, bringing the 2010 total to 86,170 - down by one per cent compared to 2009.

See the actual figures below.

"Market conditions were anything but uniform in 2010. We went from super-charged sales activity during the first four months of the year, to a marked drop-off in transactions in the summer and then in the fall saw sales climb back to levels that are sustainable over the longer
term," said TREB President Bill Johnston.

"New Federal Government-mandated mortgage lending guidelines, higher borrowing costs and misconceptions about the HST caused a pause in home buying in the summer. As it became clear that the HST was not applicable to the sale price of an existing home and buyers realized that home ownership remained affordable, market conditions improved," continued Johnston.

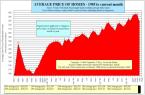
The average home selling price in 2010 was $431,463 - up nine per cent in comparison to the 2009 average selling price of $395,460. In December, the average annual rate of price growth was five per cent.

"At the outset of 2010, we were experiencing annual rates of price growth at or near 20 per cent. This was the result of extremely tight market conditions coupled with the fact that we were comparing prices to the trough of the recession at the beginning of 2009," said Jason Mercer, TREB's Senior Manager of Market Analysis.

"Balanced market conditions in the second half of 2010 resulted in more moderate home price appreciation," continued Mercer. "Expect the average selling price to grow at or below five per cent in 2011. With this type of growth, mortgage carrying costs for the average priced home in the GTA will remain affordable for a household earning an average income."

Home sales in the GTA were spread across a number of different housing types in 2010. Detached homes accounted for 49 per cent of total sales. Condominium apartments accounted for an additional 25 per cent per cent of sales. Other housing types including townhomes and semi-detached houses accounted for the final 26 per cent. In some areas like TREB's central districts the mix was quite different, with condominium apartments accounting for 61 per cent of total sales.

"Ownership housing is available in a diversity of types and price points across the GTA, allowing plenty of choice for first time buyers and experienced home buyers alike. This housing diversity is one factor that continues to make the GTA a popular choice for households and businesses," concluded Johnston.

I hope this finds you Happy and Healthy!

All the Best!

Mark


A. Mark Argentino
P. Eng. Broker
Specializing in Residential & Investment Real Estate
RE/MAX Realty Specialists Inc.
Providing Full-Time Professional Real Estate Services since 1987
BUS 905-828-3434
FAX 905-828-2829 CELL 416-520-1577
mark@mississauga4sale.com
Mississauga4Sale.com

* Thinking of selling your home in the next 3 to 6 months? Would you
like a Complimentary & Quick Over-The-Net Home Evaluation ?
www.mississauga4sale.com/internet-evaluation.htm


* Power of Sales and Foreclosures
www.mississauga4sale.com/Power-Sales-Bank-Sales-Alert-Request.htm


* If you have not already signed up to receive my monthly real estate
newsletter, you may do so here: On-Line Real Estate Newsletter sign up
www.mississauga4sale.com/popupquestion.htm


* See seasonal housing patterns
www.mississauga4sale.com/TREBprice.htm


* Would you like me to send you a desk or wall Calendar?
www.mississauga4sale.com/Calendar-Order-Form.htm

Wednesday, January 05, 2011

Happy New Year in 2011!


Happy New Year and I wish you and your family all the best in 2011!

Mark

Wednesday, December 29, 2010

TREB Affordability Indicator Share of Average Household Income Used for Mortgage Principal and Interest, Property Taxes and Utilities on the Avg


This chart plots the share of average household income that goes toward mortgage principal and interest, property taxes and utilities for the average priced home in the GTA subject to the following assumptions:
1.Average annual or year-to-date home price as reported by TREB
2.20 per cent down payment
3.Average 5-year fixed mortgage rate (Statistics Canada); 25-year amortization
4.Average property tax rate reported by/estimated from the Statistics Canada Survey of Household Spending
5.Average utilities cost reported by/estimated from the Statistics Canada Survey of Household Spending and components of the Consumer Price Index
6.Average household income reported by the Census of Canada. Years in between Censuses estimated using interpolation (years upto2005) or annual growth in average weekly earnings reported by Statistics Canada in the LabourForce Survey (2006 onward).

Toronto Real Estate Board Data and Calculation; Statistics CanadaTREB


Toronto Real Estate Board (TREB) Average Prices and GraphFor more information please contact A. Mark ArgentinoA. Mark Argentino, Broker, P.Eng.,Specializing in Residential & Investment Real EstateRE/MAX Realty Specialists Inc., Brokerage2691 Credit Valley Road, Suite 101, Mississauga, Ontario L5M 7A1BUS. 905-828-3434FAX. 905-828-2829E-MAIL: mark@mississauga4sale.comWebsite: Mississauga4Sale.com

Tuesday, December 28, 2010

TREB MLS® Sales-to-New Listings Ratio Compared to Average Annual Per Cent Change in Home Price Sales


This chart plots the monthly sales-to-new listings ratio (blue line) with year-over-year average annual per cent price change (brown line). When the sales-to-new listings ratio moves higher, average annual per cent change in home prices generally trends higher. When the sales-to-new listings ratio moves lower, average annual per cent change in home prices generally trends lower.


Toronto Real Estate Board (TREB) Average Prices and GraphFor more information please contact A. Mark ArgentinoA. Mark Argentino, Broker, P.Eng.,Specializing in Residential & Investment Real EstateRE/MAX Realty Specialists Inc., Brokerage2691 Credit Valley Road, Suite 101, Mississauga, Ontario L5M 7A1BUS. 905-828-3434FAX. 905-828-2829E-MAIL: mark@mississauga4sale.comWebsite: Mississauga4Sale.com

Monday, December 27, 2010

TREB MLS® Average Price Monthly Time Series with Trend Line Actual


This chart plots monthly MLS® average price since January 1995. The blue line shows the actual average price. The brown line is the trend computed using a 12-month moving average, which exhibits no seasonal variations or other irregular fluctuations. A substantial change in actual average price must occur to change the direction of the trend.


Toronto Real Estate Board (TREB) Average Prices and GraphFor more information please contact A. Mark ArgentinoA. Mark Argentino, Broker, P.Eng.,Specializing in Residential & Investment Real EstateRE/MAX Realty Specialists Inc., Brokerage2691 Credit Valley Road, Suite 101, Mississauga, Ontario L5M 7A1BUS. 905-828-3434FAX. 905-828-2829E-MAIL: mark@mississauga4sale.comWebsite: Mississauga4Sale.com

Saturday, December 25, 2010

Merry Christmas!

Merry Christmas and all the best to you and your family!
Mark

Toronto Real Estate Board (TREB) Average Prices and GraphFor more information please contact A. Mark ArgentinoA. Mark Argentino, Broker, P.Eng.,Specializing in Residential & Investment Real EstateRE/MAX Realty Specialists Inc., Brokerage2691 Credit Valley Road, Suite 101, Mississauga, Ontario L5M 7A1BUS. 905-828-3434FAX. 905-828-2829E-MAIL: mark@mississauga4sale.comWebsite: Mississauga4Sale.com

Thursday, December 23, 2010

TREB MLS® New Listings Monthly Time Series with Trend Line Actual


This chart plots monthly MLS® new listings since January 1995. The blue line shows actual new listings. The brown line is the trend computed using a 12-month moving average, which exhibits no seasonal variations or other irregular fluctuations. A substantial change in actual new listings must occur to change the direction of the trend.


Toronto Real Estate Board (TREB) Average Prices and GraphFor more information please contact A. Mark ArgentinoA. Mark Argentino, Broker, P.Eng.,Specializing in Residential & Investment Real EstateRE/MAX Realty Specialists Inc., Brokerage2691 Credit Valley Road, Suite 101, Mississauga, Ontario L5M 7A1BUS. 905-828-3434FAX. 905-828-2829E-MAIL: mark@mississauga4sale.comWebsite: Mississauga4Sale.com

Tuesday, December 21, 2010

TREB MLS® New Listings Monthly Time Series with Trend Line Actual


This chart plots monthly MLS® new listings since January 1995. The blue line shows actual new listings. The brown line is the trend computed using a 12-month moving average, which exhibits no seasonal variations or other irregular fluctuations. A substantial change in actual new listings must occur to change the direction of the trend.


Toronto Real Estate Board (TREB) Average Prices and GraphFor more information please contact A. Mark ArgentinoA. Mark Argentino, Broker, P.Eng.,Specializing in Residential & Investment Real EstateRE/MAX Realty Specialists Inc., Brokerage2691 Credit Valley Road, Suite 101, Mississauga, Ontario L5M 7A1BUS. 905-828-3434FAX. 905-828-2829E-MAIL: mark@mississauga4sale.comWebsite: Mississauga4Sale.com

Monday, December 20, 2010

TREB MLS® Sales Monthly Time Series with Trend Line Actual


This chart plots monthly MLS® sales since January 1995. The blue line shows actual sales. The brown line is the trend computed using a 12-month moving average, which exhibits no seasonal variations or other irregular fluctuations. A substantial change in actual sales must occur to change the direction of the trend.


Toronto Real Estate Board (TREB) Average Prices and GraphFor more information please contact A. Mark ArgentinoA. Mark Argentino, Broker, P.Eng.,Specializing in Residential & Investment Real EstateRE/MAX Realty Specialists Inc., Brokerage2691 Credit Valley Road, Suite 101, Mississauga, Ontario L5M 7A1BUS. 905-828-3434FAX. 905-828-2829E-MAIL: mark@mississauga4sale.comWebsite: Mississauga4Sale.com