Showing posts with label TREB-average-prices-toronto-2011. Show all posts

Friday, April 22, 2011

TREB MLS® Sales-to-New Listings Ratio Compared to Average Annual Per Cent Change in Home Price Sales April 2011

Explanation: This chart plots the monthly sales-to-new listings ratio (blue line) with year-over-year average annual per cent price change (brown line). When the sales-to-new listings ratio moves higher, average annual per cent change in home prices generally trends higher. When the sales-to-new listings ratio moves lower, average annual per cent change in home prices generally trends lower.


Toronto Real Estate Board (TREB) Average Prices and Graph

For more information please contact A. Mark Argentino

A. Mark Argentino, Broker, P.Eng.,
Specializing in Residential & Investment Real Estate
RE/MAX Realty Specialists Inc., Brokerage
2691 Credit Valley Road, Suite 101, Mississauga, Ontario L5M 7A1
BUS. 905-828-3434
FAX. 905-828-2829
E-MAIL: mark@mississauga4sale.com
Website: Mississauga4Sale.com

Wednesday, April 20, 2011

TREB MLS® Average Price Monthly Time Series with Trend Line Actual April 2011

Explanation: This chart plots monthly MLS® average price since January 1995. The blue line shows the actual average price. The brown line is the trend computed using a 12-month moving average, which exhibits no seasonal variations or other irregular fluctuations. A substantial change in actual average price must occur to change the direction of the trend.


Toronto Real Estate Board (TREB) Average Prices and Graph

For more information please contact A. Mark Argentino

A. Mark Argentino, Broker, P.Eng.,
Specializing in Residential & Investment Real Estate
RE/MAX Realty Specialists Inc., Brokerage
2691 Credit Valley Road, Suite 101, Mississauga, Ontario L5M 7A1
BUS. 905-828-3434
FAX. 905-828-2829
E-MAIL: mark@mississauga4sale.com
Website: Mississauga4Sale.com

Tuesday, April 19, 2011

GTA Real Estate Mid Month resale homes

This report below is the latest report from TREB showing the mid month sales are down as are listings. Still an exceptionally strong market in Mississauga and western GTA


All the best,


Mark


GTA REALTORS(r) RELEASE MID‐MONTH RESALE HOUSING FIGURES


TORONTO, APRIL 18, 2011 ‐‐ Greater Toronto REALTORS(r) reported 4,444 sales during the first two weeks of April 2011 -a three per cent decrease compared to the first two weeks of April 2010. The number of new listings was down by 21 per cent compared to the same period last year.


"ales activity was quite strong during the first two weeks of April. If this level of activity is sustained for the remainder of the month, we could see April transactions close to last year' record result. Positive economic news has kept households confident in their ability to purchase and pay for a home over the long term,"said TREB President Bill Johnston.


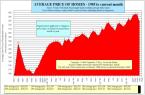
The average selling price for firm deals reported through the first two weeks of April was $483,165, representing a 12 per cent increase over the average price of $430,271 reported during the same period last year.


"he number of homes listed for sale so far in 2011 has been below expectations. Market conditions have tightened, resulting in increased competition between home buyers and accelerating rates of average price growth,"said Jason Mercer, TREB' Senior Manager of Market Analysis.


"he strong rate of price growth reported for the first two weeks of April should entice more households to list their homes for sale. This would result in more balanced market conditions and more moderate rates of price growth,"continued Mercer.


I hope this finds you Happy and Healthy!


All the Best!


Mark


A. Mark Argentino
P. Eng. Broker
Specializing in Residential & Investment Real Estate
RE/MAX Realty Specialists Inc.
Providing Full-Time Professional Real Estate Services since 1987
BUS 905-828-3434
FAX 905-828-2829 CELL 416-520-1577
mark@mississauga4sale.com
Mississauga4Sale.com


* Thinking of selling your home in the next 3 to 6 months? Would you
like a Complimentary & Quick Over-The-Net Home Evaluation ?
www.mississauga4sale.com/internet-evaluation.htm


* Power of Sales and Foreclosures
www.mississauga4sale.com/Power-Sales-Bank-Sales-Alert-Request.htm


* If you have not already signed up to receive my monthly real estate
newsletter, you may do so here: On-Line Real Estate Newsletter sign up
www.mississauga4sale.com/popupquestion.htm


* See seasonal housing patterns
www.mississauga4sale.com/TREBprice.htm


* Would you like me to send you a desk or wall Calendar?
www.mississauga4sale.com/Calendar-Order-Form.htm

Monday, April 18, 2011

TREB MLS® New Listings Monthly Time Series with Trend Line Actual April 2011

Explanation: This chart plots monthly MLS® new listings since January 1995. The blue line shows actual new listings. The brown line is the trend computed using a 12-month moving average, which exhibits no seasonal variations or other irregular fluctuations. A substantial change in actual new listings must occur to change the direction of the trend.


Toronto Real Estate Board (TREB) Average Prices and Graph

For more information please contact A. Mark Argentino

A. Mark Argentino, Broker, P.Eng.,
Specializing in Residential & Investment Real Estate
RE/MAX Realty Specialists Inc., Brokerage
2691 Credit Valley Road, Suite 101, Mississauga, Ontario L5M 7A1
BUS. 905-828-3434
FAX. 905-828-2829
E-MAIL: mark@mississauga4sale.com
Website: Mississauga4Sale.com

Friday, April 15, 2011

TREB MLS® Sales Monthly Time Series with Trend Line Actual

Explanation: This chart plots monthly MLS® sales since January 1995. The blue line shows actual sales. The brown line is the trend computed using a 12-month moving average, which exhibits no seasonal variations or other irregular fluctuations. A substantial change in actual sales must occur to change the direction of the trend.


Toronto Real Estate Board (TREB) Average Prices and Graph

For more information please contact A. Mark Argentino

A. Mark Argentino, Broker, P.Eng.,
Specializing in Residential & Investment Real Estate
RE/MAX Realty Specialists Inc., Brokerage
2691 Credit Valley Road, Suite 101, Mississauga, Ontario L5M 7A1
BUS. 905-828-3434
FAX. 905-828-2829
E-MAIL: mark@mississauga4sale.com
Website: Mississauga4Sale.com

Wednesday, April 13, 2011

TREB MLS® Average Resale Home Price Monthly with Three Previous Years for Comparison

Explanation: This chart plots the monthly MLS® average home price for the current year and the previous three years. The recurring seasonal trend can be examined along with comparisons to previous years for each month.


Toronto Real Estate Board (TREB) Average Prices and Graph

For more information please contact A. Mark Argentino

A. Mark Argentino, Broker, P.Eng.,
Specializing in Residential & Investment Real Estate
RE/MAX Realty Specialists Inc., Brokerage
2691 Credit Valley Road, Suite 101, Mississauga, Ontario L5M 7A1
BUS. 905-828-3434
FAX. 905-828-2829
E-MAIL: mark@mississauga4sale.com
Website: Mississauga4Sale.com

Monday, April 11, 2011

TREB MLS® Sales-to-New Listings Ratio Compared to Average Annual Per Cent Change in Home Price Sales

Explanation: This chart plots the monthly MLS® sales-to-new listings ratio (SNLR) for the current year and the previous three years. The recurring seasonal trend can be examined along with comparisons to previous years for each month. When the SNLR moves higher, annual average price growth generally increases –often at a rate well above inflation. When the SNLR moves lower, annual average price growth generally declines and can become negative.

Toronto Real Estate Board (TREB) Average Prices and Graph

For more information please contact A. Mark Argentino

A. Mark Argentino, Broker, P.Eng.,
Specializing in Residential & Investment Real Estate
RE/MAX Realty Specialists Inc., Brokerage
2691 Credit Valley Road, Suite 101, Mississauga, Ontario L5M 7A1
BUS. 905-828-3434
FAX. 905-828-2829
E-MAIL: mark@mississauga4sale.com
Website: Mississauga4Sale.com

Friday, April 08, 2011

TREB MLS® New Listings Monthly with Three Previous Years for Comparison

Explanation: This chart plots monthly MLS® new listings for the current year and the previous three years. The recurring seasonal trend can be examined along with comparisons to previous years for each month.

Toronto Real Estate Board (TREB) Average Prices and Graph

For more information please contact A. Mark Argentino

A. Mark Argentino, Broker, P.Eng.,
Specializing in Residential & Investment Real Estate
RE/MAX Realty Specialists Inc., Brokerage
2691 Credit Valley Road, Suite 101, Mississauga, Ontario L5M 7A1
BUS. 905-828-3434
FAX. 905-828-2829
E-MAIL: mark@mississauga4sale.com
Website: Mississauga4Sale.com

Wednesday, April 06, 2011

Toronto and GTA Historical house prices for single family dwellings back to the 1950's

TREB MLS® Sales Sales Monthly with Three Previous Years for Comparison


Explanation: This chart plots monthly MLS® sales for the current year and the previous three years. The recurring seasonal trend can be examined along with comparisons to previous years for each month.

Toronto Real Estate Board (TREB) Average Prices and Graph For more information please contact A. Mark Argentino A. Mark Argentino, Broker, P.Eng., Specializing in Residential & Investment Real Estate RE/MAX Realty Specialists Inc., Brokerage 2691 Credit Valley Road, Suite 101, Mississauga, Ontario L5M 7A1 BUS. 905-828-3434 FAX. 905-828-2829 E-MAIL: mark@mississauga4sale.com Website: Mississauga4Sale.com

Tuesday, April 05, 2011

Toronto Real Estate Board Resale activity April report for March 2011

This is the latest report from the Toronto Real Estate Board on resale activity for March 2011 Sales When comparing with the same month in 2010 the number of sales are lower by 11% and the prices are up 5% to $456,147 All the Best! Mark GTA REALTORS(r) Report Monthly Resale Housing Market Figures

TORONTO, April 5, 2011 -- Greater Toronto REALTORS(r) reported 9,262 transactions through the TorontoMLS(r) system in March 2011, representing the second best March result on record. The number

of transactions was 11 per cent lower than the record result reported in March 2010.

"The strong home sales reported in March and throughout the first quarter of 2011 have been based on a solid affordability picture and improving economic conditions in the GTA and country-wide," said Toronto Real Estate Board (TREB) President Bill Johnston.

The average selling price for March 2011 was up five per cent year-over-year to $456,147. The strongest average annual price growth was reported for condominium apartments and semi-detached houses, at approximately seven per cent for both home types.

"Market conditions were tighter in March compared to last year. With more competition between buyers, we have seen a strong but sustainable rate of price growth," said Jason Mercer, TREB's Senior Manager of Market Analysis. Median Price In March, the median price was $385,000, from the $370,000 recorded during March of 2010.

I hope this finds you Happy and Healthy!

All the Best!

Mark

A. Mark Argentino P. Eng. Broker Specializing in Residential & Investment Real Estate RE/MAX Realty Specialists Inc. Providing Full-Time Professional Real Estate Services since 1987 BUS 905-828-3434 FAX 905-828-2829 CELL 416-520-1577 mark@mississauga4sale.com Mississauga4Sale.com

* Thinking of selling your home in the next 3 to 6 months? Would you like a Complimentary & Quick Over-The-Net Home Evaluation ? www.mississauga4sale.com/internet-evaluation.htm

* Power of Sales and Foreclosures www.mississauga4sale.com/Power-Sales-Bank-Sales-Alert-Request.htm

* If you have not already signed up to receive my monthly real estate newsletter, you may do so here: On-Line Real Estate Newsletter sign up www.mississauga4sale.com/popupquestion.htm

* See seasonal housing patterns www.mississauga4sale.com/TREBprice.htm

* Would you like me to send you a desk or wall Calendar? www.mississauga4sale.com/Calendar-Order-Form.htm

Friday, March 25, 2011

TREB MLS® Average Price Monthly Time Series with Trend Line Actual March 2011

Explanation: This chart plots monthly MLS® average price since January 1995. The blue line shows the actual average price. The brown line is the trend computed using a 12-month moving average, which exhibits no seasonal variations or other irregular fluctuations. A substantial change in actual average price must occur to change the direction of the trend.


Toronto Real Estate Board (TREB) Average Prices and GraphFor more information please contact A. Mark ArgentinoA. Mark Argentino, Broker, P.Eng.,Specializing in Residential & Investment Real EstateRE/MAX Realty Specialists Inc., Brokerage2691 Credit Valley Road, Suite 101, Mississauga, Ontario L5M 7A1BUS. 905-828-3434FAX. 905-828-2829E-MAIL: mark@mississauga4sale.comWebsite: Mississauga4Sale.com

Thursday, March 24, 2011

March 2011 TREB Affordability Indicator Share of Average Household Income Used for Mortgage Principal Interest, Property Taxes, Utilities on the Avg

Explanation: This chart plots the share of average household income that goes toward mortgage principal and interest, property taxes and utilities for the average priced home in the GTA subject to the following assumptions:
1.Average annual or year-to-date home price as reported by TREB
2.20 per cent down payment
3.Average 5-year fixed mortgage rate (Statistics Canada); 25-year amortization
4.Average property tax rate reported by/estimated from the Statistics Canada Survey of Household Spending
5.Average utilities cost reported by/estimated from the Statistics Canada Survey of Household Spending and components of the Consumer Price Index
6.Average household income reported by the Census of Canada.


Toronto Real Estate Board (TREB) Average Prices and GraphFor more information please contact A. Mark ArgentinoA. Mark Argentino, Broker, P.Eng.,Specializing in Residential & Investment Real EstateRE/MAX Realty Specialists Inc., Brokerage2691 Credit Valley Road, Suite 101, Mississauga, Ontario L5M 7A1BUS. 905-828-3434FAX. 905-828-2829E-MAIL: mark@mississauga4sale.comWebsite: Mississauga4Sale.com

Wednesday, March 23, 2011

March 2011 TREB MLS® Sales-to-New Listings Ratio Compared to Average Annual Per Cent Change in Home Price Sales

Explanation: This chart plots the monthly sales-to-new listings ratio (blue line) with year-over-year average annual per cent price change (brown line). When the sales-to-new listings ratio moves higher, average annual per cent change in home prices generally trends higher. When the sales-to-new listings ratio moves lower, average annual per cent change in home prices generally trends lower.


Toronto Real Estate Board (TREB) Average Prices and GraphFor more information please contact A. Mark ArgentinoA. Mark Argentino, Broker, P.Eng.,Specializing in Residential & Investment Real EstateRE/MAX Realty Specialists Inc., Brokerage2691 Credit Valley Road, Suite 101, Mississauga, Ontario L5M 7A1BUS. 905-828-3434FAX. 905-828-2829E-MAIL: mark@mississauga4sale.comWebsite: Mississauga4Sale.com

Tuesday, March 22, 2011

GTA Home Sales Mid month report from the Toronto Real Estate Board


This is the mid-month report from the Toronto Real Estate Board for home sales in the GTA

Compared to first two weeks of March 2010 sales and new listings are down, but average prices are up by nearly 5%


GTA REALTORS(r) Report Monthly Resale Housing Market Figures

TORONTO, March 16, 2011 -- Greater Toronto REALTORS(r) reported 4,138 sales during the first two weeks of March 2011 - a five per cent decrease compared to the first two weeks of March 2010. The number of new listings also dipped - down by 15 per cent compared to the same period last year.

"A positive economic outlook for the Greater Toronto Area, including steady growth in jobs and incomes, has kept households confident in their ability to purchase and pay for a home over the long term," said Toronto Real Estate Board (TREB) President Bill Johnston.

The average price for transactions during the first 14 days of March was $460,196, representing a 4.6 per cent increase compared to the first two weeks of March 2010.

"Market conditions are tighter compared to this time last year, resulting in more competition between buyers and sustained upward pressure on the average selling price. The annual rate of price growth is expected to range between three and five per cent in 2011," said Jason Mercer, TREB's Senior Manager of Market Analysis.

I hope this finds you Happy and Healthy!

All the Best!

Mark

A. Mark Argentino
P. Eng. Broker
Specializing in Residential & Investment Real Estate
RE/MAX Realty Specialists Inc.
Providing Full-Time Professional Real Estate Services since 1987
BUS 905-828-3434
FAX 905-828-2829 CELL 416-520-1577
mark@mississauga4sale.com
Mississauga4Sale.com

* Thinking of selling your home in the next 3 to 6 months? Would you
like a Complimentary & Quick Over-The-Net Home Evaluation ?
www.mississauga4sale.com/internet-evaluation.htm


* Power of Sales and Foreclosures
www.mississauga4sale.com/Power-Sales-Bank-Sales-Alert-Request.htm


* If you have not already signed up to receive my monthly real estate
newsletter, you may do so here: On-Line Real Estate Newsletter sign up
www.mississauga4sale.com/popupquestion.htm


* See seasonal housing patterns
www.mississauga4sale.com/TREBprice.htm


* Would you like me to send you a desk or wall Calendar?
www.mississauga4sale.com/Calendar-Order-Form.htm

Monday, March 21, 2011

TREB MLS® New Listings Monthly Time Series with Trend Line Actual March 2011

Explanation: This chart plots monthly MLS® new listings since January 1995. The blue line shows actual new listings. The brown line is the trend computed using a 12-month moving average, which exhibits no seasonal variations or other irregular fluctuations. A substantial change in actual new listings must occur to change the direction of the trend.


Toronto Real Estate Board (TREB) Average Prices and GraphFor more information please contact A. Mark ArgentinoA. Mark Argentino, Broker, P.Eng.,Specializing in Residential & Investment Real EstateRE/MAX Realty Specialists Inc., Brokerage2691 Credit Valley Road, Suite 101, Mississauga, Ontario L5M 7A1BUS. 905-828-3434FAX. 905-828-2829E-MAIL: mark@mississauga4sale.comWebsite: Mississauga4Sale.com

Friday, March 18, 2011

TREB MLS® Sales Monthly Time Series with Trend Line Actual

Explanation: This chart plots monthly MLS® sales since January 1995. The blue line shows actual sales. The brown line is the trend computed using a 12-month moving average, which exhibits no seasonal variations or other irregular fluctuations. A substantial change in actual sales must occur to change the direction of the trend.


Toronto Real Estate Board (TREB) Average Prices and GraphFor more information please contact A. Mark ArgentinoA. Mark Argentino, Broker, P.Eng.,Specializing in Residential & Investment Real EstateRE/MAX Realty Specialists Inc., Brokerage2691 Credit Valley Road, Suite 101, Mississauga, Ontario L5M 7A1BUS. 905-828-3434FAX. 905-828-2829E-MAIL: mark@mississauga4sale.comWebsite: Mississauga4Sale.com

Thursday, March 17, 2011

TREB MLS® Average Resale Home Price Monthly with Three Previous Years for Comparison

Explanation: This chart plots the monthly MLS® average home price for the current year and the previous three years. The recurring seasonal trend can be examined along with comparisons to previous years for each month.


Toronto Real Estate Board (TREB) Average Prices and GraphFor more information please contact A. Mark ArgentinoA. Mark Argentino, Broker, P.Eng.,Specializing in Residential & Investment Real EstateRE/MAX Realty Specialists Inc., Brokerage2691 Credit Valley Road, Suite 101, Mississauga, Ontario L5M 7A1BUS. 905-828-3434FAX. 905-828-2829E-MAIL: mark@mississauga4sale.comWebsite: Mississauga4Sale.com

Wednesday, March 16, 2011

TREB MLS® Sales-to-New Listings Ratio Compared to Average Annual Per Cent Change in Home Price Sales

TREB MLS® Sales-to-New Listings Ratio Monthly with Three Previous Years for Comparison

Explanation: This chart plots the monthly MLS® sales-to-new listings ratio (SNLR) for the current year and the previous three years. The recurring seasonal trend can be examined along with comparisons to previous years for each month. When the SNLR moves higher, annual average price growth generally increases –often at a rate well above inflation. When the SNLR moves lower, annual average price growth generally declines and can become negative.


Toronto Real Estate Board (TREB) Average Prices and GraphFor more information please contact A. Mark ArgentinoA. Mark Argentino, Broker, P.Eng.,Specializing in Residential & Investment Real EstateRE/MAX Realty Specialists Inc., Brokerage2691 Credit Valley Road, Suite 101, Mississauga, Ontario L5M 7A1BUS. 905-828-3434FAX. 905-828-2829E-MAIL: mark@mississauga4sale.comWebsite: Mississauga4Sale.com

Monday, March 14, 2011

TREB MLS® New Listings Monthly with Three Previous Years for Comparison

TREB MLS® New Listings Monthly with Three Previous Years for Comparison


Toronto Real Estate Board (TREB) Average Prices and GraphFor more information please contact A. Mark ArgentinoA. Mark Argentino, Broker, P.Eng.,Specializing in Residential & Investment Real EstateRE/MAX Realty Specialists Inc., Brokerage2691 Credit Valley Road, Suite 101, Mississauga, Ontario L5M 7A1BUS. 905-828-3434FAX. 905-828-2829E-MAIL: mark@mississauga4sale.comWebsite: Mississauga4Sale.com