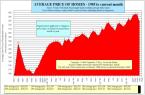
Explanation: This chart plots the monthly MLS® sales-to-new listings ratio (SNLR) for the current year and the previous three years. The recurring seasonal trend can be examined along with comparisons to previous years for each month. When the SNLR moves higher, annual average price growth generally increases –often at a rate well above inflation. When the SNLR moves lower, annual average price growth generally declines and can become negative.

For more information please contact A. Mark Argentino
A. Mark Argentino, Broker, P.Eng.,
Specializing in Residential & Investment Real Estate
RE/MAX Realty Specialists Inc., Brokerage
2691 Credit Valley Road, Suite 101, Mississauga, Ontario L5M 7A1
BUS. 905-828-3434
FAX. 905-828-2829
E-MAIL:
mark@mississauga4sale.comWebsite:
Mississauga4Sale.com


No comments:
Post a Comment