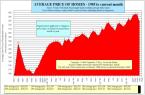
1.Average annual or year-to-date home price as reported by TREB
2.20 per cent down payment
3.Average 5-year fixed mortgage rate (Statistics Canada); 25-year amortization
4.Average property tax rate reported by/estimated from the Statistics Canada Survey of Household Spending
5.Average utilities cost reported by/estimated from the Statistics Canada Survey of Household Spending and components of the Consumer Price Index
6.Average household income reported by the Census of Canada

For more information please contact A. Mark Argentino
A. Mark Argentino, Broker, P.Eng.,
Specializing in Residential & Investment Real Estate
RE/MAX Realty Specialists Inc., Brokerage
2691 Credit Valley Road, Suite 101, Mississauga, Ontario L5M 7A1
BUS. 905-828-3434
FAX. 905-828-2829
E-MAIL: mark@mississauga4sale.com
Website: Mississauga4Sale.com


No comments:
Post a Comment