Showing posts with label national-prices. Show all posts

Thursday, January 24, 2008

Comments on Canada's Economy from RBC

The Canadian economy still robust

Canada's economy grew at a 2.9% annual rate in the third quarter, only moderately slower than the 3.8% second-quarter pace and first-quarter 3.5% increase. The strength in the third quarter came from the domestic economy, which has been the mainstay of Canada's economic growth during the past several years.

Job growth beat expectations once again in November, with 42,600 jobs created, trouncing forecasts for an 8,000 job gain. The job market has generated 388,200 new jobs so far this year and the pace of wage gains has accelerated strongly from the tepid 2.3% average increase in the first quarter to the 4.2% average pace in October-November.

Retail sales fell 0.2% in September for the third time in the past four months,largely driven by a 1.3% drop in sales by new car dealers. The decline in real retailsales and the only modest increase in manufacturing shipments in September pointto moderating GDP growth in the month.

Housing starts were essentially unchanged in November, coming in at a 227,900 annualized pace compared to 227,600 in October. The average level of housing starts activity year-to-date has been the highest since 2004. Our forecast assumes that starts will trend lower, eventually averaging a little above 200,000 in 2008.

The merchandise trade surplus widened to $3.3 billion in October as exports inched lower by 0.5% and imports dropped 2%. After shaving 4.8 percentage points from third-quarter economic growth, drag from the trade sector and slower domestic demand will slow GDP growth again in the fourth quarter.

Canada's core inflation rate moved to its lowest level since April 2006 in November, and held below the 2% target for the second month running. The all-items inflation rate will likely remain above the Bank of Canada's 2% target in the near-term, but continued discounting by Canadian retailers will keep the core rate below the 2% target.

Search the MLS or read more about Interest Rates, Power of Sale Properties, Price Trends and more at my website. Homes for Sale

Thank you for reading my blog and if there is anything else I can help you with please don't hesitate to contact me,

Mark

A. Mark Argentino
P. Eng. Broker
Specializing in Residential & Investment Real Estate


Thinking of Selling? Best Mortgage Rates Current Home Prices Search MLS
RE/MAX Realty Specialists Inc.

Providing Full-Time Professional Real Estate Services since 1987

( BUS 905-828-3434
2
FAX 905-828-2829 ÈCELL 416-520-1577
E-MAIL : mark@mississauga4sale.com
8 Website : Mississauga4Sale.com


Friday, January 18, 2008

RBC reporting Canadian Economy still expanding, but the pace likely to slow


RBC is reporting that the Canadian Economy still expanding, but the pace likely to slow


The economy grew at a 0.2% pace in October and at a 1.4% annualized pace compared to the 2.9% average of the third quarter, setting up for a more moderate quarter for growth following nine months of robust expansion.


Despite the slowdown in job growth in December, Canada's job market pumped out 370,000 new jobs in 2007 and the unemployment rate finished the year near its lowest level in 33 years. The 2007 job increase pushed the number of job created since 2002 above two-million and 82% of those jobs were full-time positions.


Retail activity started the fourth quarter on a firm note, rising 0.1% in October, stronger than market forecasts for a 0.4% decline. The strong labour market and firm wage growth will likely support retail activity as the fourth quarter progresses.


Housing starts slowed to a 187,500 seasonally adjusted annual rate in December from an upwardly revised 233,300 pace in November. Starts were 229,600 in 2007, a 1% gain over 2006. The housing market may cool a bit in 2008 we forecast starts of 210,000 units in the year.


The merchandise trade surplus was larger than expected in November, rising to $3.7 billion. But, with a strong Canadian dollar boosting imports and a sharply slower U.S. economy dampening demand for Canadian exports, we expect the drag coming from the trade sector to be even greater in 2008 than in 2007 and that the economy will grow at a more modest 2.1%.


Canada's core inflation rate moved to its lowest level since April 2006 in November, and held below the 2% target for the second month running. The all-items inflation rate will likely remain above the Bank of Canada's 2% target in the near-term, but continued discounting by Canadian retailers will keep the core rate below the 2% target.


Search the MLS or read more about Interest Rates, Power of Sale Properties, Price Trends and more at my website. Homes for Sale


Thank you for reading my blog and if there is anything else I can help you with please don't hesitate to contact me,


Mark


A. Mark Argentino
P. Eng. Broker
Specializing in Residential & Investment Real Estate


Thinking of Selling? Best Mortgage Rates Current Home Prices Search MLS
RE/MAX Realty Specialists Inc.

Providing Full-Time Professional Real Estate Services since 1987

( BUS 905-828-3434
2
FAX 905-828-2829 ÈCELL 416-520-1577
E-MAIL : mark@mississauga4sale.com
8 Website : Mississauga4Sale.com


Saturday, January 12, 2008

Real Estate Market Update from New Home Building Permit Perspective

Building Permits: From Boom to Gloom?

We don't normally write about a drop in Canadian building permits, even one like the 9.9% setback in November. However, given the suddenly heightened sensitivity over every twitch in the economy, today's decline is worth looking at, especially given the fact that it follows hard on the heels of a 19.6% drop in December housing starts and last week's 12.8 point plunge in the Ivey PMI for the same month. Is this trio of steep sags in admittedly third-tier economic indicators an ominous warning for the Canadian economy? In two words…probably not. While there is plenty to be concerned about on the outlook primarily the softening U.S. economy this sudden run of weak data in very volatile series is likely noise.

Putting it in perspective, building permits in the first 11 months of 2007 were up a hefty 12.4% from year-ago levels even with the November decline. And, keep in mind that the drop in November followed a 7.3% pop in the prior month. The latest setback was concentrated in the non-residential sector, which had been particularly frothy earlier last year (up 15.5% so far in 2007). Residential permits were also off 5% m/m, but were up by a surprisingly sprightly 10.5% year-to-date. (Contrast that with the 25% y/y plunge in U.S. building permits in the same period.)

Most provinces saw declines in November, led by Alberta (-13.8%) and B.C. (-20.0%). However, the top of last year's leaderboard was still crowded with western provinces. Permits in Saskatchewan were up 33.9% last year, with Alberta (15.2%) next in line. Notably, Ontario was in third spot, thanks to a strong 26% rise in non-residential activity.

In a separate release, new home prices were a touch firmer than expected in November, rising 0.5% m/m. This held the annual trend steady at 6.1%. In a sign of just how far-flung home price pressures are in Canada, the two biggest monthly increases were posted in Halifax and Quebec City. In contrast, new prices dipped again in Calgary, where annual price increases of 5% are now below the national average.


The Bottom Line: The Canadian building industry appears to be in the first stages of losing some momentum after a blow-out year in 2007. That's still a far cry from the deepening housing descent in clear view south of the border. In fact, given widespread talk of labour shortages in the Canadian industry, some cooling in the sector in 2008 may not be such a bad thing.

Search the MLS or read more about Interest Rates, Power of Sale Properties, Price Trends and more at my website. Homes for Sale

Thank you for reading my blog and if there is anything else I can help you with please don't hesitate to contact me,

Mark

A. Mark Argentino
P. Eng. Broker
Specializing in Residential & Investment Real Estate

Thinking of Selling? Best Mortgage Rates Current Home Prices Search MLS
RE/MAX Realty Specialists Inc.

Providing Full-Time Professional Real Estate Services since 1987
( BUS 905-828-3434
2
FAX 905-828-2829 ÈCELL 416-520-1577
E-MAIL : mark@mississauga4sale.com
8 Website : Mississauga4Sale.com

Tuesday, December 11, 2007

Canadian Housing Starts still high -- November 2007


Canadian Housing Starts Steady


New housing construction showed no signs of letting up in November. Housing starts, at an annualized rate of 227,900, were virtually unchanged from October and roughly in line with both market expectations and the pace in the last 12 months. Activity on the single-detached side bounced to its strongest level since March 2006, more than retracing some softness in October. The multi-units side continued to digest a 29-year-high spike in September and fell for the second straight month.


On a provincial basis, activity cooled in six provinces in November with the biggest declines in Quebec, Nova Scotia and Manitoba. Hefty gains in Ontario and B.C., however, heated things just enough to keep the overall temperature steady. In recent months, momentum has shifted from Alberta to B.C. as Western Canada's housing construction hotspot. In Central Canada, Ontario has regained leadership (notwithstanding a multi-unit surge in September), while Newfoundland & Labrador is the key engine in Atlantic Canada.


The Bottom Line: Despite earlier concerns about the potential impact of the financial market storm on Canadian housing demand, home building remains a pillar of strength in the Canadian economy. With strong job creation and favourable interest rates still providing support, residential construction is carrying good momentum into 2008.


read more about GTA Property Trends


Search the MLS or read more about Interest Rates, Power of Sale Properties, Price Trends and more at my website. Homes for Sale


Thank you for reading my blog and if there is anything else I can help you with please don't hesitate to contact me,


Mark


A. Mark Argentino
P. Eng. Broker
Specializing in Residential & Investment Real Estate


Thinking of Selling? Best Mortgage Rates Current Home Prices Search MLS
RE/MAX Realty Specialists Inc.

Providing Full-Time Professional Real Estate Services since 1987

( BUS 905-828-3434
2
FAX 905-828-2829 ÈCELL 416-520-1577
E-MAIL : mark@mississauga4sale.com
8 Website : Mississauga4Sale.com


Monday, November 19, 2007

Average house prices anticipated to rise by 9.5 per cent nationally


Average house prices anticipated to rise by 9.5 per cent nationally

(NC)-A booming start to 2007 and solid price appreciations in all areas of the country have paved the way for a promising outlook for the Canadian housing market. The strong economy has fuelled consumer confidence, driving demand across the country.


"The momentum from the year's extraordinary start spilled into the second quarter, compounding typically busy spring market activity and stimulating solid price appreciations in almost all regions of the country. These conditions will certainly be an impetus characterizing Canada's real estate market through to year's end," said Phil Soper, president and chief executive officer, Royal LePage Real Estate Services.


These healthy and robust conditions are anticipated to prevail throughout the year as all Canadian regions are expected to experience a rise in average house prices with double-digit gains forecasted for Edmonton, Calgary, Winnipeg and Regina in 2007. In addition, modest mid-single digit increases are expected for Central and Atlantic Canada.


The national average house price is forecast to rise by 9.5 per cent this year, passing the $300,000 mark for the first time, to $303,300. Home sale transactions are also projected to rise by eight per cent to 522,306 unit sales by the end of 2007.


What's happening in your market? http://www.mississauga4sale.com/TREBprice.htm


City Anticipated Price Change in 2007

Halifax 4.6% +
Montreal 6.0% +
Ottawa 6.2% +
Toronto 5.0% +
Winnipeg 11.9% +
Regina 13.8% +
Calgary 35.0% +
Edmonton 39.5% +
Vancouver 12.0% +

Search the MLS or read more about Interest Rates, Power of Sale Properties, Price Trends and more at my website. Homes for Sale


Thank you for reading my blog and if there is anything else I can help you with please don't hesitate to contact me,


Mark


A. Mark Argentino
P. Eng. Broker
Specializing in Residential & Investment Real Estate


Thinking of Selling? Best Mortgage Rates Current Home Prices Search MLS
RE/MAX Realty Specialists Inc.

Providing Full-Time Professional Real Estate Services since 1987

( BUS 905-828-3434
2
FAX 905-828-2829 ÈCELL 416-520-1577
E-MAIL : mark@mississauga4sale.com
8 Website : Mississauga4Sale.com


Sunday, September 09, 2007

August Sets New Record, Breaks 8,000 Sales

Toronto Real Estate Board (TREB) Average Prices and Graph

August Sets New Record, Breaks 8,000 Sales

TORONTO - Thursday, September 6, 2007 -- August 2007 became the fifth record-setting month in a row, with 8,059 sales reported by TREB Members throughout the Greater Toronto Area, TREB President Donald Bentley announced today. "This figure is up 15 per cent over August of last year, and up seven per cent over the 7,498 sales recorded during the same month in 2005, which was the previous "best ever" performance for the month of August," said the President. "Summer of 2007 has been hands-down the most active holiday season for the resale market in the history of the Toronto Real Estate Board."

While sales roared ahead, prices remained affordable in August, with a recorded average of $361,890. This figure is up seven per cent over the $338,192 recorded during August of 2006. "While the last decade has seen five record breaking years, and a good possibility of a sixth in 2007, year-over-year prices increases have remained in the single digits. This kind of activity is sustainable for a long time."

Breaking down the total, 3,057sales were reported in TREB's 28 West districts and averaged $343,493; 1,444 sales were reported in the 14 Central districts and averaged $453,718; 1,653 sales were reported in the 23 North districts and averaged $403,539; and 1,905 sales were reported in TREB's 21 East districts and averaged $285,665.

Search the MLS or read more about Interest Rates, Power of Sale Properties, Price Trends and more at my website. Homes for Sale

Thank you for reading my blog and if there is anything else I can help you with please don't hesitate to contact me,

Mark

A. Mark Argentino
P. Eng. Broker
Specializing in Residential & Investment Real Estate

Thinking of Selling? Best Mortgage Rates Current Home Prices Search MLS
RE/MAX Realty Specialists Inc.

Providing Full-Time Professional Real Estate Services since 1987
( BUS 905-828-3434
2
FAX 905-828-2829 ÈCELL 416-520-1577
E-MAIL : mark@mississauga4sale.com
8 Website : Mississauga4Sale.com

Tuesday, August 28, 2007

US Price Trends Improve, Existing-Home Sales Lag


Price Trends Improve, Existing-Home Sales Lag
During the second quarter, home prices improved in the majority of U.S. metro areas, but sales activity remained below year-ago levels in most states, according to research by the NATIONAL ASSOCIATION OF REALTORS®.

Price increases were apparent in 97 of the 149 metropolitan statistical areas surveyed by NAR. That compares with just 83 metro areas that had price increases in the first quarter of 2007, and 68 areas in the fourth quarter of 2006.

"Although home prices are relatively flat, more metro areas are showing price gains since bottoming-out in the fourth quarter of 2006," says Lawrence Yun, NAR senior economist. "Recent mortgage disruptions will hold back sales temporarily, but the fundamental momentum clearly suggests stabilizing price trends in many local markets."

The national median existing single-family home price was $223,800 in the second quarter, down 1.5 percent from the year-earlier period, when the median price was $227,100. The median is a typical market price where half of the homes sold for more and half sold for less, but there has been a downward skew in the national comparison because sales have declined in many high-cost areas and risen in some lower cost markets.

NAR President Pat V. Combs says homes continue to be good investments, especially since typical owners stay in their home for six years. "While local conditions vary greatly, a typical owner who bought six years ago is seeing a 45 percent increase in the value of their home," she says.

An analysis of all available data over the past six years shows almost every market experienced price gains from the second quarter of 2001 to the second quarter of this year.

Sales Pace Down 11% Nationally

Total state existing-home sales, including single-family and condo, were at a seasonally adjusted annual rate of 5.91 million units in the second quarter, down 10.8 percent from a 6.63 million-unit pace in the second quarter of 2006.

Six states showed increases in the sales pace from a year ago; one was unchanged and complete data for two states were not available.

According to Freddie Mac, the national average commitment rate on a 30-year conventional fixed-rate mortgage was 6.37 percent in the second quarter, up from 6.22 percent in the first quarter; the rate was 6.6 percent in the second quarter of 2006.

Most, Least Affordable Areas in the U.S.

During the second quarter, median single-family home prices ranged from a very affordable $71,700 in Elmira, N.Y., to 12 times that amount in the San Jose-Sunnyvale-Santa Clara area of California, where the median price was $865,000.

The second most expensive area was San Francisco-Oakland-Fremont, at $846,800, followed by the Anaheim-Santa Ana-Irvine area (Orange County, Calif.), at $727,000.

In addition to Elmira, other affordable markets include the Youngstown-Warren-Boardman area of Ohio and Pennsylvania, at $76,700, and the Saginaw-Saginaw Township North area of Michigan, with a second-quarter median price of $86,900.

The biggest price gains were found in the Salt Lake City area, where the median price of $233,100 rose 21.9 percent from a year ago. Next was Binghamton, N.Y., at $111,200, up 19.8 percent from the second quarter of 2006, followed by Salem, Ore., where the second quarter median price rose 16.7 percent to $227,900. Most of the metros with price declines were modest, although four areas experienced double-digit drops.

The best total sales performance was in Wyoming, where existing-home sales rose 10.8 percent from the second quarter of 2006. In Iowa, the second-quarter sales pace rose 4.1 percent from a year ago, while North Dakota experienced the third strongest gain, up 2.9 percent. Oklahoma, Indiana, and Nebraska also posted annual sales gains.

A Closer Look at Regional Sales, Price Data

Northeast: Existing-home sales fell 6.8 percent to an annual pace of 1.05 million units in the second quarter from the same period a year ago. The median existing single-family home price rose 0.7 percent to $298,000 in the second quarter from the same period 2006.

After Binghamton, N.Y., the strongest price increase in the Northeast was in the Allentown-Bethlehem-Easton area of Pennsylvania and New Jersey, with a median price of $274,500, up 12.8 percent from the second quarter of last year, followed by the Reading, Penn., area, at $157,800, up 11.2 percent, and Glenn Falls, N.Y., which rose 10.7 percent to $175,500.

Midwest: Existing-home sales dropped 8.4 percent to a 1.39 million-unit annual level in the second quarter compared with a year ago. The median existing single-family home price was $163,500, down 2.2 percent from the second quarter of 2006.

The strongest metro price increase in the Midwest was Bismarck, N.D., area where the median price of $151,400 was 9.2 percent higher than a year ago. Next was Gary-Hammond, Ind., at $137,800, up 7.3 percent from the second quarter of 2006, and Bloomington-Normal, Ill., at $161,500, up 7 percent.

South: Existing-home sales in the South were at an annual rate of 2.31 million units in the second quarter, down 10.7 percent from the second quarter of 2006. The median existing single-family home price was $185,000 in the second quarter, which is 1.6 percent below a year earlier.

The strongest price increase in the South was in the Beaumont-Port Arthur area of Texas, at $127,700, up 11.8 percent from a year ago, followed by the Cumberland area of Maryland and West Virginia, with a 9.3 percent gain to $109,300, and Raleigh-Cary, N.C., at $225,100, up 8.4 percent.

West: The existing-home sales pace of 1.16 million units was down16.9 percent from the second quarter of 2006. The median existing single-family home price was $349,400 in the second quarter, down 0.4 percent from a year ago.

After Salt Lake City and Salem, the strongest metro price increase in the West was in Farmington, N.M., at $201,900, up 14.0 percent from a year ago, followed by the Spokane, Wash., area, at $197,700, up 10.4 percent from the second quarter of 2006.

What's Happening With Condos?

In the condo sector, metro area condominium and cooperative prices – covering changes in 55 metro areas – show the national median existing condo price was $226,800 in the second quarter, up 1 percent from $224,500 in the second quarter of 2006. Thirty-seven metros showed annual increases in the median condo price, including seven areas with double-digit gains; one was unchanged and 17 areas had price declines.

The strongest condo price gains were in the Salt Lake City area, where the second quarter price of $162,200 rose 25.2 percent from a year earlier, followed by Reno-Sparks, Nev., at $220,500, up 17 percent, and the Austin-Round Rock area of Texas, where the median condo price of $172,100 rose 14.9 percent from the second quarter of 2006.

Metro area median existing-condo prices in the second quarter ranged from $116,400 in Greensboro-High Point, N.C., to $608,700 in the San Francisco-Oakland-Fremont area. The second most expensive condo market reported was Los Angeles-Long Beach-Santa Ana, at $413,400, followed by the San Diego-Carlsbad-San Marcos area at $368,600.

Other affordable condo markets include Wichita, Kan., at $117,900 in the second quarter, and Rochester, N.Y., at $118,900. from REALTOR® Magazine Online


This was an interesting perspective from the USA on their current marketplace


Toronto Real Estate Board (TREB) Average Prices and Graph Read more about our Toronto and GTA Real Estate Marketplace and Average Price Trends

For more information please contact me.

Thank you,
Mark

A. Mark Argentino
P. Eng. Associate Broker
Specializing in Residential & Investment Real Estate


Thinking of Selling? Best Mortgage Rates Current Home Prices Search MLS Newsletter
RE/MAX Realty Specialists Inc.
Providing Full-Time Professional Real Estate Services since 1987

(
BUS 905-828-3434
2
FAX 905-828-2829 ÈCELL 416-520-1577
E-MAIL : mark@mississauga4sale.com
Website : Mississauga4Sale.com

Would you like a Complimentary & Quick Over-The-Net Home Evaluation ?


P. S. If you have not already signed up to receive my monthly real estate newsletter, you may do so here:
On-Line Real Estate Newsletter sign up

Wednesday, August 15, 2007

Where is the market heading? In light of increased mortgage interest rates.


I received another email question today and thought I would post my long-winded answer below and share my thoughts with you too.


Enjoy! Mark

The question was:


Just wondering what is happening in the market after interest rates went
up.

Is there a lot of Townhomes on the market and are prices coming down.
Just wandering if is a good time to invest again.

Thanks

A.

Here's my answer:


Hi A.,

The market is quite fast these days. Normally, it slows down in the summer, but this summer has been quite active. Average prices are down a couple of percent which is typical for this time of year, but the volume of sales is hitting records. See the link below. Normally there are about 40-50 townhomes in Erin Mills for sale at any one time, but there are only 34 right now and many of them are conditionally sold.

Yes, this is a very good time to invest.


I realize the rates have increased but only marginally and it will likely only be short term. We are going short on all of our mortgages, time proves short term is by far the better option, see here, of course probably until I follow that method! :-))

There are not too many major scenarios that will cause real estate market to tank. One scenario is major global catastrophe or war or terrorist act. All could cause sudden and major drop in market, but the stock market would take a huge hit too. So would our entire economy, so all things being equal, anything major will affect everything, so real estate should still be a good long term investment. Time has proven real estate will recover and then some, so I am not worried, besides, it would just mean we get less rent, if we don't have to sell, all is fine, but more properties!

Another thing that could happen is that interest rates continue to climb. Once they reach 7 or 8 percent the economy will slow and then rates will stabilize and/or come down again. This may only last a year or two and then the economy will settle down again. Increasing rates certainly cut out the very bottom entry level buyers, but there seems to be enough buyers out there to sustain and continue to cause prices to rise and record sales month after month.

Another possibility is the US economy continues to be bad or gets worse. Although it used to be that "if the US got a sniffle Canada would get a cold or the flu", no longer seems to be the case. Our marketplace in the GTA, Ontario and Canada seems to have been insulated from events in the US since about 911 and seems to be able to sustain itself regardless of what happens to our friends south of the border.

Oil prices rise to $100 or more per barrel. Again, yes, this will have an impact on our marketplace, but maybe only short term. The demand for gasoline seems to be completely inelastic, regardless of how high gasoline and oil prices rise, we still drive large vehicles and conserve very little. We may complain like hell about the price at the pumps, but we pay it and keep driving.

US election years have almost always caused our market to slow, EXCEPT in 2004. Thus, it's your guess whether our market and economy slows next year or not.

Un-Employment rates rise, due to dollar, economy or overseas markets could cause our market to slow, people spend less money and the economy stalls, again, this would affect all markets, not just real estate.

Another scenario is that the baby boomers all get old in the next ten years and sell off their real estate and/or give it to their kids who cash out. Either way, if a flood of listings were to come on the market it could affect our prices in the short and long term. Personally, this does not worry me. There seems to be enough people out there to absorb any increase in inventory, but only time will tell on this one. I believe it will be much more gradual than people think. Fractional ownership worries me more than the boomers cashing out. I may be wrong on this and I've not researched the success or failure of fractional ownership in other parts of Canada or the world, but if time shares are any indication, I think that this may hurt more people than help them in the long run.

At any rate, these are some of the scenarios that the doomsayers are predicting and hopefully none of them will come to fruition and even if they do, I feel they will have less impact on our real estate market than some think.

There are other possible scenarios, I would like to hear your feelings and ideas, but these are some of the major reasons for large price swings in the market in the past and could be for the future too.

If history repeats itself again this fall, prices will likely escalate again in mid to late September until middle of November, see the graph here, so make your purchase soon or wait until December 10th to purchase and hope there are some listings on the market at that time that you like!

In summary, and I know it sounds corny, I still go by the old adage that the best time to buy real estate is yesterday.

Thanks,
Mark


Toronto Real Estate Board (TREB) Average Prices and Graph

For more information please contact A. Mark Argentino

A. Mark Argentino, Broker, P.Eng.,
Specializing in Residential & Investment Real Estate
RE/MAX Realty Specialists Inc., Brokerage
2691 Credit Valley Road, Suite 101, Mississauga, Ontario L5M 7A1

BUS. 905-828-3434
FAX. 905-828-2829
E-MAIL: mark@mississauga4sale.com
Website: Mississauga4Sale.com

Tuesday, July 10, 2007

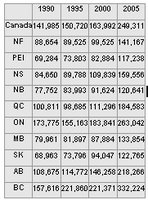
Canadian National Housing prices since 1990 to 2005

MLS® Average Residential Price - Canada and Provinces 1990–2005 (dollars)

Toronto Real Estate Board (TREB) Average Prices and GraphCanada Housing Observer

Now in its fourth year of publication, the Observer is a flagship CMHC publication that presents a detailed annual review of housing conditions and trends in Canada and the key factors behind them.

The 2006 edition included an enlightening chart comparing housing costs across the country over the past 15 years, a sampling of which follows:

MLS® Average Residential Price - Canada and Provinces 1990–2005 (dollars)


See Toronto and GTA average price graphs

For more information please contact A. Mark Argentino

A. Mark Argentino, Broker, P.Eng.,
Specializing in Residential & Investment Real Estate
RE/MAX Realty Specialists Inc., Brokerage
2691 Credit Valley Road, Suite 101, Mississauga, Ontario L5M 7A1

BUS. 905-828-3434
FAX. 905-828-2829
E-MAIL: mark@mississauga4sale.com
Website: Mississauga4Sale.com


Tuesday, June 26, 2007

New Housing Costs rise Substantially in April

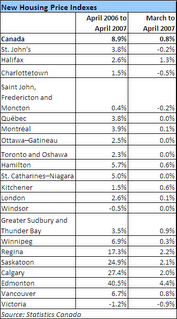
Toronto Real Estate Board (TREB) Average Prices and Graph The cost of new housing rose substantially in April, rising 0.8 per cent from the previous month.

Contractors' selling prices were up 8.9 per cent from a year earlier as 12 of 21 metropolitan areas surveyed registered increases.

Edmonton led all monthly increases, at 4.4 per cent, as well as annual increases, at 40.5 per cent.

Regina (up 2.2 per cent), Saskatoon (2.1) and Calgary (2) followed as monthly price advances were mostly attributable to materials and labour; noteworthy gains were also recorded in Halifax, Greater Sudbury and ThunderBay, Ont., and Vancouver.

Five metropolitan areas registered no monthly change. Victoria (-0.9%) recorded the largest decrease due to a moderating market. Prices in St.John's, Saint John, Fredericton and Moncton, and Charlottetown also declined.

Land prices rose in only five of 12 metropolitan areas surveyed.

See more statistics for resale homes at this page


For more information please contact A. Mark Argentino

A. Mark Argentino, Broker, P.Eng.,
Specializing in Residential & Investment Real Estate
RE/MAX Realty Specialists Inc., Brokerage
2691 Credit Valley Road, Suite 101, Mississauga, Ontario L5M 7A1

BUS. 905-828-3434
FAX. 905-828-2829
E-MAIL: mark@mississauga4sale.com
Website: Mississauga4Sale.com

Wednesday, June 20, 2007

Residential Real Estate Shatters Records Across Canada


MLS® resale housing market shatters all previous records in May
Major market activity on track to set a new annual record in 2007

OTTAWA – June 14, 2007 – MLS® residential sales activity, new listings, average prices and dollar volume in Canada's major markets broke all previous monthly records in May, according to statistics released by The Canadian Real Estate Association (CREA).

Actual MLS® home sales activity in Canada's major markets was up 11.6 per cent year-over-year to 42,039 units in May 2007. Led by year-over-year gains in Toronto and Montréal, this was the first time in history that sales activity in Canada's major markets surpassed 40,000 transactions in one month.

On a seasonally adjusted basis, activity rose by 1.3 per cent from the previous month to 31,053 units in May. The increase was fueled by a monthly increase in activity in Vancouver, Winnipeg, London & St. Thomas, Ottawa and Montréal. Seasonally adjusted sales activity set new monthly records in Winnipeg, Ottawa, Montréal and Saint John, and reached the second highest level on record in Saskatoon, Regina and Toronto.

“Dramatic price increases and additional listings in Alberta's major markets are causing some buyers in that province to take a bit longer to make a purchasing decision,” notes CREA Chief Economist Gregory Klump.

Year-to-date transactions also set new records in most major markets in May. Transactions via Board and Association MLS® systems numbered 165,800 units in Canada's major markets during the first five months of 2007, which represents an increase of 8.5 per cent over the same period last year.

“Activity broke all previous records in the first quarter, and gained momentum in the second quarter,” Klump said. “The increase in transactions for the year-to-date suggests activity is on track to set a new annual record this year.”

MLS® residential new listings also reached the highest level ever in May, climbing 6.7 per cent year-over-year to 63,165 units. This was also the first time that the number of new listings on Board and Association MLS® systems in Canada's major markets surpassed 60,000 units in a single month.

Seasonally adjusted MLS® residential new listings rose 0.8 per cent month-over-month to 49,665 units in May to surpass the previous monthly record set in October 1990. The monthly increase was fueled by a large rise in new listings in Edmonton, and additional new listings in Calgary and Saskatoon. Seasonally adjusted new listings in Calgary and Edmonton reached their highest levels ever in May.

The major market MLS® residential average price rose 10.2 per cent year-over-year to set a new monthly record of $333,524 in May. Average price reached the highest monthly level on record in many of Canada's major markets including Vancouver, Calgary, Edmonton, Regina, Saskatoon, Toronto, London & St. Thomas, Hamilton-Burlington & District, Montréal, Quebec City and Halifax-Dartmouth.

“With mortgage interest rates on the rise and an increasing supply of new listings on the market, CREA expects that price increases will return to the single digits in the second half of this year,” added Klump. “CREA forecasts that the annual national average price will rise by 9.5 per cent in 2007, and by 5.5 per cent in 2008.”

“Canada's resale housing industry is a driving force behind the national economy, and a new study released by The Canadian Real Estate Association shows the average MLS® home sale generates $32,200 in additional consumer spending above and beyond the purchase price,” said CREA President Ann Bosley. “Job creation is also a major spin-off benefit of the resale housing market, with more than 94,000 jobs created in Canada each year as a direct result of resale housing transactions.”

CREA cautions that average price information can be useful in establishing trends over time, but does not indicate actual prices in centres comprised of widely divergent neighborhoods or account for price differential between geographic areas. Statistical information contained in this report includes all housing types.

MLS® is a co-operative marketing system used only by Canada's real estate Boards to ensure maximum exposure of properties listed for sale.

The Canadian Real Estate Association (CREA) is one of Canada's largest single-industry trade associations, representing more than 90,000 REALTORS® working though more than 100 real estate Boards and Associations. CREA's primary mission is to represent members at the federal level, and to defend the public's right to own and enjoy property.

This report is published by the Communications Department of The Canadian Real Estate Association (CREA). Further information can be found at www.crea.ca.

Read more about average prices

Toronto Real Estate Board (TREB) Average Prices and Graph

For more information please contact A. Mark Argentino

A. Mark Argentino, Broker, P.Eng.,
Specializing in Residential & Investment Real Estate
RE/MAX Realty Specialists Inc., Brokerage
2691 Credit Valley Road, Suite 101, Mississauga, Ontario L5M 7A1

BUS. 905-828-3434
FAX. 905-828-2829
E-MAIL: mark@mississauga4sale.com
Website: Mississauga4Sale.com

Tuesday, June 05, 2007

First time in Canada - Average home sale tops $300,000

Average home sale tops $300,000 for first time
Last Updated: Tuesday, May 29, 2007 4:49 PM ET

The average price of a resale home in Canada has moved above the $300,000 level for the first time ever.
Data from the Multiple Listing Service show that the average home sold for $305,542 in April, according to the Canadian Real Estate Association.
Average MLS price for resale home
Region
Apr/07
Increase from Apr/06
B.C.
$431,909
11.1%
Alberta
$359,640
29.8%
Saskatchewan
$163,811
23.8%
Manitoba
$171,130
8.2%
Ontario
$299,796
4.7%
Quebec
$208,693
6.0%
Nova Scotia
$191,076
6.6%
N.B.
$139,138
3.6%
P.E.I.
$135,019
7.5%
N.L.
$142,497
1.1%
Yukon
$250,255
23.9%
N.W.T.
$328,904
15.0%
Canada
$305,542
9.3%
Source: Canadian Real Estate Assn.

That's up 9.3 per cent (or $26,000) from the average sale a year ago.
New record highs were recorded in every province from Quebec westward, as well as in Nova Scotia.

The highest provincial average can still be found in British Columbia. Its $431,909 average is up 11.1 per cent year-over-year as the average resale price in Vancouver topped $564,000 last month.

Alberta's average resale price of $359,640 was up 29.8 per cent over the April 2006 figure — the biggest percentage increase among any province. Put another way, that means that the average homeowner in Alberta made $82,500 on paper simply by living in their home over the past year.

Data released earlier this month showed average resale prices in Calgary had reached $420,000 in April.
Saskatchewan posted a 23.8 per cent price hike to $163,811.
But Manitoba, Ontario, Quebec, and the Atlantic provinces reported much more modest, single-digit price increases.
"Anecdotal evidence suggests that resale housing activity in westernmarkets is being boosted by a shortage of lots and by buyers who are ready to move up but don’t want to wait for a newly constructed home to be completed," said Gregory Klump, chief economist for the Canadian Real Estate Association.
MLS stats also showed year-to-date sales at a record high. In the first four months of 2007, 172,421 homes were sold in Canada through the MLS system. That's up 6.7 per cent from the same period last year.

See average Toronto and GTA prices at this pageToronto Real Estate Board (TREB) Average Prices and Graph

For more information please contact A. Mark Argentino

A. Mark Argentino, Broker, P.Eng.,
Specializing in Residential & Investment Real Estate
RE/MAX Realty Specialists Inc., Brokerage
2691 Credit Valley Road, Suite 101, Mississauga, Ontario L5M 7A1

BUS. 905-828-3434
FAX. 905-828-2829
E-MAIL: mark@mississauga4sale.com
Website: Mississauga4Sale.com

Wednesday, May 16, 2007

How Do Canada’s executive homes rank with others around the world?


How Canada’s executive homes rank with others around the world


A new survey by Century 21 Canada says that executives working in the
downtown business districts of Canada’s hottest real estate markets,
such as Vancouver and Calgary, experience house prices and daily
commute times that rank with those in the world’s major financial
centres of London, England, New York, Paris and Seoul.

The survey of typical house prices was conducted by Century 21 Canada
in 15 cities in Canada and in 16 cities around the world.

In Canada’s regional hub cities, such as Halifax, Winnipeg and
Saskatoon, executives working downtown face house prices and daily
commute times that rank with the world’s least expensive capital
cities such Moscow, Singapore and Istanbul.

In between are Toronto, Montreal, Ottawa, Quebec City and Victoria,
where executive prices and daily commute times compare with Tokyo,
Taipei and Mexico City.

Don Lawby, president of Century 21 Canada, says, “Whether executive
house prices are at the high or low end of the range, in Canada or
elsewhere in the world, depends on the current state of the local
economies – and our survey reflects that Vancouver and Calgary are
booming whether you compare them to cities in the rest of Canada or to
cities around the world.”

He says Canadian cities at every price level have benefits that can’t
be measured in dollars or commuting time.

“All things considered, Canadian cities offer among the best living
and working conditions in the world. We have low levels of population
congestion, we breathe fresh air, nature is at our doorstep, and we
have few security problems. You can’t say these things of many other
major cities in the world, which might have stifling heat or humidity,
crushing congestion, or choking pollution.

“Our three largest cities – Toronto, Montreal and Vancouver – are as
cosmopolitan as any cities in the world. We can sample and enjoy
nearly all the major cultures of the world right here,” says Lawby.

The homes selected for inclusion in the Century 21 survey are based on
the knowledge and experience of Century 21 brokers in each of the 31
cities around the world. Their selections are representative of the
typical homes chosen by executives who work in the downtown core in
each of the cities.

The survey found that the 10 most expensive housing markets for
executive home buyers working in the downtown business districts are
London, England, $5.68-million; New York, $2.5-million;
Vancouver, $1.55-million; Sydney, Australia, $1.4-million; Paris,
$1.39-million; Seoul, $1.25-million; Calgary, $1.2-million; Nicosia,
$1-million; Toronto, $890,000; and Victoria, $850,000.

The 10 least expensive markets are Moncton, $249,900; Singapore,
$304,135; London, Canada, $325,000; Bogota, $368,852; St. John’s,
$379,000; Charlottetown, $379,000; Saskatoon, $429,000; Winnipeg,
$450,000; Istanbul, $471,927; and Edmonton, $489,900.

“Another way to view the survey results and to provide another
observation into the lifestyle of executives around the world is to
compare the price to the size of the home,” says Lawby.

“This shows that markets where homes are traditionally smaller – such
as Taipei and Tokyo – move toward the top of the list, while Toronto,
Victoria and others fall from the top 10,” says Lawby.

When comparing prices to sizes of the homes, the Century 21 survey
found that the 10 most expensive housing markets in the world for
executive home buyers working in the downtown business districts per
square foot are London, England, $3,156; Paris, $1,163; Seoul, $1,097;
Calgary, $800; Sydney, Australia, $722; Taipei, $613; Vancouver, $574;
Athens, $491; New York, $480; and Tokyo, $385.

The 10 least expensive markets per square foot are Mexico City, $75;
London, Canada, $98; St. John’s, $105; Moncton, $119; Halifax, $125;
Bogota, $137; Charlottetown, $146; Quebec, $147 Winnipeg, $150; and
Johannesburg, $163.

Some examples of typical executive homes from the Century 21 study:

In Toronto, a typical executive choice would be a four-bedroom,
five-bath 3,200-square-foot home on a 7,500-square-foot lot near Yonge
Street and Steeles Avenue, priced at $890,000 and a 45-minute drive to
the Bay Street financial district.

In Montreal, a typical executive choice would be a three-bedroom,
two-bath 2,000-square-foot home on a 19,656-square-foot lot on a golf
course at Blainville, priced at $589,000 and 40-minute commute to
downtown by train or car.

In Vancouver, a typical executive choice would be a four-bedroom, 2 ½
bath 2,700-square-foot home on an 8,750-square-foot-lot in
Ambleside-By-The-Sea in West Vancouver, priced at $1.55 million and a
30-minute commute across the Lion’s GateBridge to downtown Vancouver.

In Calgary, a typical executive choice would be a three-bedroom,
three-bath 1,500-square-foot home on a 6,250-square-foot-lot in
Roxboro, priced at $1.2 million and a 25-minute drive to the downtown
business core and the CalgaryTower.

In Winnipeg, a typical executive choice would be a four-bedroom, 3 ½
bath 3,000-square-foot home on a 9,000-square-foot lot in Tuxedo,
priced at $450,000 and a 15-minute drive to Portage Avenue and Main
Street, the downtown focal point.

In Halifax, a typical executive choice would be a four-bedroom,
three-bath, 4,000-square-foot home on a one-acre country lot in
Kingswood, priced at $500,000 and a 30-minute drive to the downtown or
to Citadel Hill, the national historic site overlooking the harbour.

In New York, a typical executive choice would be a five-bedroom,
five-bath 5,200-square-foot home on a 20,878-square-foot lot, priced
at $2.5 million in RoslynHeights, Long Island, and 45 minutes to the
Wall Street financial district by subway or car.

In London, England, a typical executive choice would be a two-bedroom,
two-bath, 1,800-square-foot penthouse apartment in fashionable Notting
Hill, priced at $5.68 million, a 30-minute drive to the financial
district and a 15-minute stroll to KensingtonPalace and Gardens.

In Paris, a typical executive choice would be a three-bedroom,
one-bath 1,195-square-foot duplex apartment in the city centre, priced
at $1.39 million and a three-minute walk from the Sacré Cœur Basilica.

In Seoul, a typical executive choice would be a four-bedroom,
two-bath, 1,139-square-foot apartment in Gangman district on the south
side of the HangangRiver, priced at $1.25 million and a 30-minute
commute to the business core.

In Sydney, Australia, a typical executive choice would be a
three-bedroom, two-bath 1,938-square-foot penthouse apartment in
Pagewood, priced at $1.4 million, 20 minutes from the downtown and 15
minutes from the Sydney Opera House.

In Tokyo, a typical executive choice would be a four-bedroom, two-bath
1,722-square-foot home on a 1,884-square-foot lot at YokohamaCity,
priced at $663,109 and 45 minutes by train to downtown Tokyo.

Read more about Toronto Prices

Toronto Real Estate Board (TREB) Average Prices and Graph

For more information please contact A. Mark Argentino

A. Mark Argentino, Broker, P.Eng.,
Specializing in Residential & Investment Real Estate
RE/MAX Realty Specialists Inc., Brokerage
2691 Credit Valley Road, Suite 101, Mississauga, Ontario L5M 7A1

BUS. 905-828-3434
FAX. 905-828-2829
E-MAIL: mark@mississauga4sale.com
Website: Mississauga4Sale.com

Tuesday, April 24, 2007

What Percentage do you think the single home prices will increase annually in the next 5 years in Mississauga?

This was a good question in an email and I thought you may wish to read my response.

DEAR MARK
THANKS FOR SENDING THE VALUABLE INFORMATION ON REAL ESTATE. AT WHAT RATE PERCENTAGE DO YOU THINK THE SINGLE HOMES' PRICES WILL INCREASE ANNUALLY IN THE NEXT FIVE YEARS IN MISSISSAUGA ?. I AM EXPECTING AN HONEST REPLY ON THIS.THANKS .
Arun B.


Hello Arun B.,

Thank you for your real estate inquiry. In my opinion, nobody can predict what the markets will do over that period of time. I can tell you that the market will remain strong for at least the next 1 to 2 months. There are changes in our market. It is not 'on fire' the way it was for the past few years. If you look at this graph, you will see that the market has only continued to climb at a high rate of about 6% to 8% per year since 1995

No matter what anyone has told you, the west GTA market has slowed compared to recent years, it's still a good market but not booming the way it way. People who bought new homes in any year from about 1998 could resell the home for a large profit by the time they closed. This is no longer the case. People who bought new homes last year and have just closed are having difficulty breaking even. This is in spite of the fact that we are at the 'high time' of the year.

Another observation. For the first time that I can ever remember, and I have been tracking prices since I got into the business in 1987, the March average price was lower than the February average price. This is unheard of. For the past 20 years March prices were higher than February, except this year. The price dropped 1%, not a large amount, but it dropped rather than increase. This too is significant and indicated our market is not booming any more. This could change in the future, but for the near future prices are likely to stay about the same as they are now.

My 'best guess' for the long term is that we will see increases in year over year prices, but they will be about 2 to 3% per year and not the 5 to 8% that we have seen in years over the last decade. There will always be pockets that will outperform the average prices and this too is one of the keys when buying real estate. It is still all about location.

Please let me know if you have any other questions or if there is anything else I can help you with.

Thank you again for contacting me and I will do my best to help you with your real estate needs,

Mark

Read more about prices

Toronto Real Estate Board (TREB) Average Prices and Graph

For more information please contact A. Mark Argentino

A. Mark Argentino, Broker, P.Eng.,
Specializing in Residential & Investment Real Estate
RE/MAX Realty Specialists Inc., Brokerage
2691 Credit Valley Road, Suite 101, Mississauga, Ontario L5M 7A1

BUS. 905-828-3434
FAX. 905-828-2829
E-MAIL: mark@mississauga4sale.com
Website: Mississauga4Sale.com

Monday, April 23, 2007

Wow - Didn't anyone notice this announcement on Down-payment changes in Canada?


Did you hear the latest on mortgages in Canada?

There was a major change to federal legislation regarding high-ratio mortgages in Canada last Friday April 20th. Effective immediately, residential mortgages with a loan to value ratio between 75 - 80% will no longer require insurance through CMHC or GE. This change was announced by the Finance Minister on Friday.

What this means is that you now only require 20% downpayment to avoid those 'high ratio' insurance fees. This coupled with the fact that 30 and 40 year mortgages are now readily available in Canada means two things:

1- affordability has improved dramatically in the past few months as both of these changes reduce either the fees charged or monthly payments.
2- this also means that prices will rise due to more people being able to afford the entry level properties.

This is a significant change in real estate ownership in Canada. I don't think many people noticed or even gave it much thought, but these two changes alone could increase affordability by as much as 30% which also means that house prices will rise due to these two changes. This certainly makes the banks happy, as they will now be able to loan out more money.

Take a $250,000 townhome as an example. You may now use the premium you would have paid for putting only 20% downpayment, which is 1% of the mortgage, so in this case, the mortgage amount with 20% downpayment is $200,000 (since 20% of $250,000 is $50,000 downpayment) and you save $2,000 insurance premium. Now you take a 40 year mortgage the payment is $1056 per month versus a 25 year mortgage $1250/month and your payment difference is $194 per month. At today's rate of say 5.75% this 194 payment is worth an extra $36,000 in mortgage payment, plus the $2000 fee you saved, this all means that you can afford an extra $38,000 most of which can be put towards your purchase price. The bottom line in this example is that you can afford about a $280,000 townhome with 20% downpayment and 40 year mortgage, that's a huge difference and will help to put upward pressure on prices.

Any comments? email me

This also means that thousands of websites and online mortgage calculators, mine included, must all be changed to reflect these changes, no small task! This change is so new that CMHC has not even updated their site to reflect the new rules, as of April 23rd.

You can do mortgage calculations for your situation at this link.

Toronto Real Estate Board (TREB) Average Prices and Graph

For more information please contact A. Mark Argentino

A. Mark Argentino, Broker, P.Eng.,
Specializing in Residential & Investment Real Estate
RE/MAX Realty Specialists Inc., Brokerage
2691 Credit Valley Road, Suite 101, Mississauga, Ontario L5M 7A1

BUS. 905-828-3434
FAX. 905-828-2829
E-MAIL: mark@mississauga4sale.com
Website: Mississauga4Sale.com

Sunday, April 22, 2007

CIBC World Markets predicts Canadian house prices will double in the next 20 years

The Canadian Imperial bank of Commerce (CIBC) has issued a press release and they predict that the price of real estate in Canada will double in the next two decades

CIBC World Markets predicts Canadian house prices will double in the next 20 years
Wednesday April 18, 9:00 am ET


- Fears of a decline sparked by demographics greatly exaggerated -
TORONTO, April 18 /CNW/ - CIBC (CM: TSX; NYSE) - Canadian house prices are likely to double in the next 20 years, according to a CIBC World Markets report released today, entitled "Much Ado About Nothing: Canadian House Prices Not Based on Demographics Alone."

"Despite downward pressure from demographic forces, on average, we expect house prices in Canada to double in the next 20 years," says Benjamin Tal, Senior Economist, CIBC World Markets. "Fears of a decline resulting from the downsizing and increased liquidations of houses by seniors and the falling number of first time buyers are highly exaggerated."

The CIBC report compares population growth between two cycles of housing prices, from 1987 to 2006 and from 2007 to 2026, using Statistics Canada's medium-growth, medium-immigration projection as a benchmark.

Between 2007 and 2026, the projected 167,000 net decline in the number of first time buyers (Canadians between the ages of 25 and 44) is marginal, at best, Mr. Tal said. Since this age group is by far the largest contributor to overall housing demand, accounting for almost 68 per cent of all home sales, this relatively modest downturn will not significantly impact housing demand.

The largest decline (2.5 million) is projected for the 45 to 54 age group, as many baby boomers move to the next age bracket. The impact of this change is also expected to be limited, given that the 45 to 54 age group accounts for only 12 per cent of total housing demand. In fact, this moderate decline in housing demand will be partly offset by the strong increase in the age group 55 to 74 and its surprisingly high housing market activity - largely reflecting purchases of vacation and investment properties.

"We estimate that in the coming twenty years, the Canadian housing market will face extra supply of roughly 250,000 houses," adds Tal. "While at first glance this appears to be a large number, it means an average extra supply of only 12,500 homes a year during that period."

Considering that total housing starts during the previous cycle averaged 180,000 per year, builders will only have to reduce new supply to just under 170,000 to completely eliminate any negative demographic influence on house prices compared to the previous cycle.

Concerns regarding the impact of demographic forces on the Canadian housing market were first raised in the late 1980s. However, during the twenty year period from 1987 to 2007, Canada experienced a three per cent annual increase in real home prices.

Although housing market activity in the coming 20 years will fluctuate, CIBC projects that the average real house price will mirror the performance of the past two decades.

"Assuming a two per cent annual inflation rate, this means that house prices in Canada are expected to double by 2026," said Mr. Tal. "This increase, of course, will not be symmetrical - with large cities seeing even larger increases in home valuations."

See average price graph for past 20 years

Toronto Real Estate Board (TREB) Average Prices and Graph

For more information please contact A. Mark Argentino

A. Mark Argentino, Broker, P.Eng.,
Specializing in Residential & Investment Real Estate
RE/MAX Realty Specialists Inc., Brokerage
2691 Credit Valley Road, Suite 101, Mississauga, Ontario L5M 7A1

BUS. 905-828-3434
FAX. 905-828-2829
E-MAIL: mark@mississauga4sale.com
Website: Mississauga4Sale.com

Friday, April 13, 2007

Did the bottom fall out? Overvalued Canadian market or just a matter of time before we follow the US?

I've been reading articles recently about the fact that our real estate market prices have cooled. Will the souring US markets eventually affect our markets here in Canada? Many think this may be the case. Or could this be due to a one month (March) price drop?

This person below seems to think our market prices will fall in the future because we are influenced so much by what happens in the US. Nobody knows for sure, but if the press continues to publish articles like this our markets may follow their lead!

All the best,
Mark


Prepare for lower real estate prices
No guarantee that U.S. meltdown won't spread here

It's hard to find experts in Canada who are concerned that the real estate chaos swirling around next door could hop the border and rattle the housing market here. Well, not yet anyway.

Those who believe the Canadian market is on solid ground will find evidence to support their views when they get a look at housing starts for March (released this morning) and the new housing price index for February (tomorrow). Both are expected to show that Canada's housing market is holding steady amid the downturn to the south.

But if you're the sort of investor who can't help but wonder if Canada must eventually follow the U.S. lead -- a natural instinct given that Canada follows on so many other issues -- you may want to skip the Canadian figures.

Instead, head straight for the words of U.S. central bankers and get their take on housing: The worse it is in the United States, the more reason to worry about the situation here.

This afternoon, the U.S. Federal Reserve releases the minutes from the last Federal Open Markets Committee, on March 21. At that meeting, the committee left short-term interest rates unchanged, but said in its statement that "the adjustment in the housing sector is ongoing."

That is likely code for "quite frankly, the housing sector scares us" -- and the minutes will say more about it.

They have good reason to be scared. In the United States, home prices are tumbling, foreclosures are rising and few are confident the downturn has hit bottom yet. It's a rough time to contemplate buying a home.

Just as worrying, tightening credit conditions and the fact that current homeowners can no longer count on an appreciating market could wreck consumer confidence, which can hit economic growth.

Most Canadians are fully aware of our neighbour's problems. However, the prevailing wisdom is that real estate is a local market and it all boils down to the ''location, location location'' mantra, which should protect us from any sort of copycat debacle.

"Can we say that there are ominous parallels between what is happening in the U.S. and what will happen in Canada? I doubt it," said Bart Melek, senior economist at BMO Capital Markets. "It is a fundamentally different market. The structure is different."

U.S. consumers had to ride an upswing in interest rates from 1% in 2003 to 5.25% today, a much more volatile ride than that experienced by Canadian consumers.

At the same time, U.S. loan requirements -- which included 0% downpayments in some cases -- were far looser. And lastly, the Canadian economy is in better shape.

But there's at least one important factor Canada shares with the United States: overvaluation. House prices here have risen to a point where BCA Research believes they are 28% overvalued, based on comparisons with gross domestic product and competing assets, just as house prices were once widely believed to be overvalued in the United States.

With U.S. prices now coming down, it's not hard to envision a similar price-chop here. Few see it now, but that's the best time to prepare yourself. From National Post article dberman@nationalpost.com David Berman, Financial Post

See recent market trends in the GTA


Toronto Real Estate Board Average Prices and Graph

For more information please contact A. Mark Argentino

A. Mark Argentino, Broker, P.Eng.,
Specializing in Residential & Investment Real Estate
RE/MAX Realty Specialists Inc., Brokerage
2691 Credit Valley Road, Suite 101, Mississauga, Ontario L5M 7A1

BUS. 905-828-3434
FAX. 905-828-2829
E-MAIL: mark@mississauga4sale.com
Website: Mississauga4Sale.com